Abstract
Many dog genetic disease, which can mean that the rate of inbreeding is the result. Canine hip dysplasia (CHD) is a common hereditary developmental disease of the coxofemoral joints and one of the most important bone and joint diseases. CHD is characterized by subluxation of the femoral head and deformation of the acetabulum leading to a painful osteoarthrosis. The radiographic diagnosis is sometime possible when the disease has markedly progressed. Looking up now studies with dog genetic disease a dwarfism (Germany shepherd), progressive retinal atrophy (Mastiff), malignant fever (all variety). With molecular biological techniques are being developed. This study, the hip dysplasia and early diagnosis that can be genetic markers to develop a more 22K SNP chip using the hip dysplasia in the X-ray diagnostics have Labrador retriever 48 of blood from the Wizard Genomic DNA Purification Kit using the DNA was extracted. This consists of SNP information, the entire 22,362 Canine SNP22 Beadchip used, SNP genotyping was carried out. Associated with hip phenotype for QTL detection for each SNP marker regression analysis using R statistical program (single SNP regression analysis) through the expression of hip additive effect of SNP marker for the evaluation. As the primary analysis of hip dysplasia in SNPs they have significance to the 4, 38, X chromosome respectively 11, 4, 10 results were excavated a total of 25 (genome-wise P < 0.001).
Figures & Tables
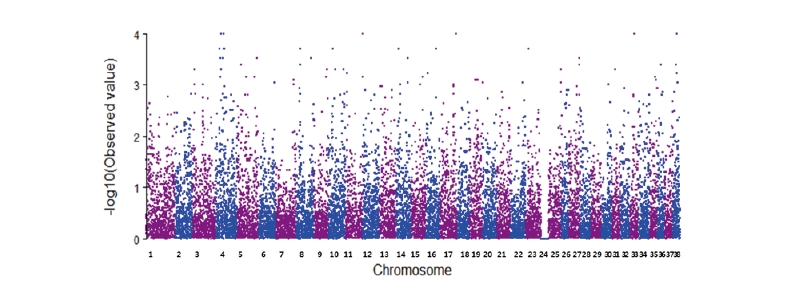
Figure 1. Manhattan plot of P-value for HIP score CHD in LR. The log inverse P-values estimated for each polymorphism are plotted in the y-axis.