Abstract
Backfat thickness, an important quantitative economic trait, directly affects productivity in the swine industry. In this study, we estimated genetic parameters for four backfat thickness traits using information from both genome-wide single nucleotide polymorphism (SNP) chip and pedigree data. Four backfat thickness phenotypes were measured in 1,105 F2 progeny from an intercross between Landrace and Jeju native black pigs. All animals in the F2 intercross were subjected to genotypic analysis using PorcineSNP60K BeadChip platform and 39,992 SNP markers on autosomes filtered by quality control criteria were used to construct genomic relationship matrix for genetic parameter estimation. Restricted maximum likelihood (REML) and genomic restricted maximum likelihood (GREML) estimates of genetic parameters were obtained using both genomic- and pedigree- relationship matrix in linear mixed models. The heritability estimates showed a high level of concordance between the REML (0.48-0.57) and GREML (0.48-0.60) estimates. However, the standard errors of the heritability estimated using GREML (0.04-0.05) were smaller than those which were estimated using REML (0.10-0.11). The backfat thickness traits showed high positive phenotypic correlations with each other, ranging from 0.62 to 0.83. These traits showed higher positive genetic correlation coefficients (REML: 0.80-0.99, GREML: 0.93-0.99) compared to the phenotypic correlation coefficients. The standard errors of the genetic correlation coefficient estimated using GREML (0.003-0.02) were smaller than those which were estimated using REML (0.01-0.09). The results of this study showed that the backfat thickness traits had high heritability and genetic correlation. The accuracy of genetic parameters estimated by GREML was higher than those which were estimated using REML. However, additional studies may be necessary to verify the results obtained from this study.
Acknowledgements
본 연구는 농촌진흥청 경상과제 “재래돼지 집단간 유전특성 및 번식형질 유전자 특성분석 연구(과제번호 PJ01198501)”의 지원과 2017년도 농촌진흥청 국립축산과학원 전문연구원 연수과정 지원사업에 의해 이루어진 것임.
Figures & Tables
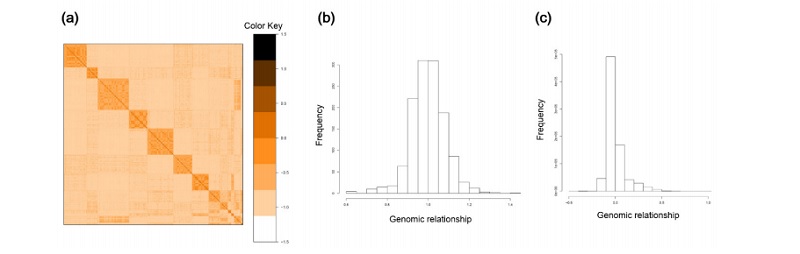
Figure 1 (a) Heatmap of the genomic relationship matrix G used in this study. (b) Histogram of offdiagonal elements of the genomic relationship matrix. (c) Histogram of diagonal elements of the genomic relationship matrix.