Abstract
Figures & Tables
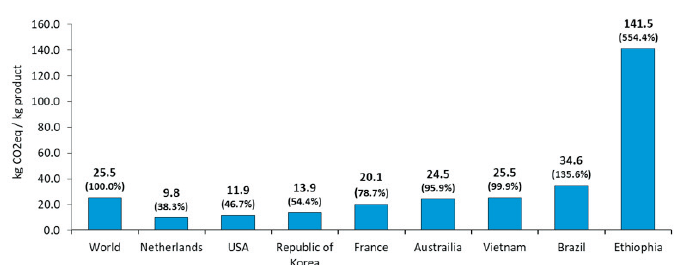
Fig. 1. Beef carbon footprints and relative percentage to the world average in major countries based on emission intensity in 2017. Source: FAO (2020)
1Department of Animal Biotechnology, Jeonbuk National University, Jeonju, 54932, Republic of Korea
2Department of Agricultural Economics, Jeonbuk National University, Jeonju, 54932, Republic of Korea
Fig. 1. Beef carbon footprints and relative percentage to the world average in major countries based on emission intensity in 2017. Source: FAO (2020)