Abstract
This study used registration data on 546,473 animals in 3 swine breeds of the Korea Animal Improvement Association from 2014 to June 2017. According to the breeding scale, 5 groups were defined less than 100 animals, between 100 animals and 300 animals, between 300 and 500, 500 or over and whole animals. To create time series data, the data were divided at the intervals of 1 month. To predict change trend, SAS/ETS program, time series ARIMA model was utilized to analyze. The animals count prediction trend was analyzed for each swine breeding scale for 1 future year after June 2017. Compared to July 17, the predicted animals count in June 2018 of swine farms with less than 100 animals was about 430(24.6%) animals increase, those with between 100 and 300, about 389(11.5%) animals increase and those with between 300 and 500, about 972(21.6%) animals increase. Farms with 500 animals or over were found to have approximately 620(10.6%) animals increase, and the whole farms, about 2,843(17.1%) animals increase. Lastly, future trend was analyzed according to each swine breeding scale. Farms with less than 100 animals were found to have decrease in general. Excluding them, all of the farms with each breeding scale were expected to have increase as a whole. If the time series prediction method and analysis results for the breeding scale presented in this study are used as reference materials for setting the proper breeding scale of domestic swine breeding farms, it will be helpful for the development of the breeding and swine farming industry.
Figures & Tables
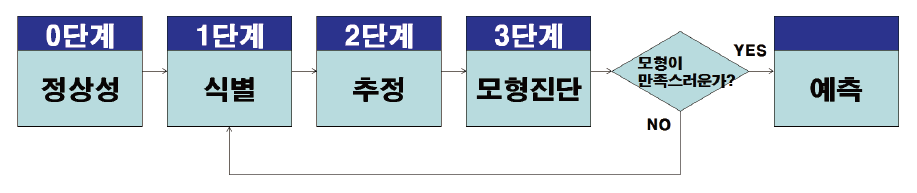
Figure 1. ARIMA Model setting Flowchart.