Abstract
Figures & Tables

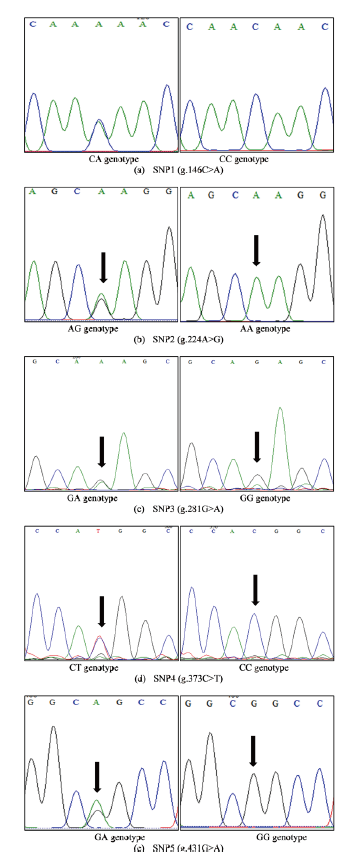
Figure 1. Electrophoregrams of the caprine gene showing five SNPs. (a) g.146C>A, (b) g.224A>G and (c) g.281G>A, (d) g.373C>T and (e) g.431G>A.
Dyah Maharani1,* Simon P. Ginting2 Simon Elieser2 Andi Tarigan2 I Gede Saputra Budisatria1 Antonius 2 Dwi Nur Happy Hariyono3 Aprilianna Putri Zahara Nafsina Luvita Sari1
11Faculty of Animal Science, Universitas Gadjah Mada, Jl. Fauna 3, Bulaksumur, Yogyakarta 55281, Indonesia
2Indonesian Goat Research Institute Sei Putih, Galang 20585, North Sumatera, Indonesia
3Department of Animal Science, Faculty of Agriculture, Universitas Khairun, Ternate 97719, Indonesia

Figure 1. Electrophoregrams of the caprine gene showing five SNPs. (a) g.146C>A, (b) g.224A>G and (c) g.281G>A, (d) g.373C>T and (e) g.431G>A.