Genetic diversity and relationship of Nigerian Muscovy duck populations

Sola-Ojo Foluke Eunice1,*   Adeniyi Charles Adeola2   Lameck Ajuma Odongo3   Yusuf Opeyeimi Akinkunmi4   Momoh Esther ohunene4   Adekoya Adeola Rukayat4   Adedibu Iyetunde Ifeyori5   

1University of Ilorin, Ilorin, Kwara State, Nigeria
2State Key Laboratory of Genetic Resources and Evolution, Kunming Institute of Zoology, Chinese Academy of Sciences, Kunming, China
3Kunming College of Life Science, University of Chinese Academy of Sciences, Kunming, China
4Department of Animal Production, University of Ilorin
5Ahmadu Bello University, Zaria, Kaduna State, Nigeria

Abstract

Muscovy duck (Caraina Moschata) is an economically important species due its unique meat taste and low-caloric content. It is one of the domestic poultry species in Nigeria as it ensures food security to the rural sectors. Rearing of Muscovy is concentrated in some part of the country due to its peculiar nature as water loving poultry species and peoples belief. In this study, we analyzed the genetic diversity and relationship of Muscovy duck populations collected from 15 different locations where Muscovy duck lovers resides in four states (Kaduna, Kwara, Niger and Oyo) of Nigeria based on Nuclear DNA Cytochrome P450 Family 2 Subfamily U Member 1 (CYP2U1) gene. A total of 48 polymorphic sites consisting of substitutions with 33 singletons variables was observed. The 82 sequences were assigned into 32 distinct haplotypes. Haplotype diversity was 0.7925. The Phylogenetic analysis showed close clustering across all locations with the exception of BART 495, PAT 35 and KEY 764 individuals. The maternal genetic structure likely suggests the extensive genetic intermixing within the country. In addition, the differentiation of BART 495, PAT 35 and KEY 764 may be due to a certain demographic history and/or artificial selection that shaped its haplotype profile. The current data on Nigerian Muscovy duck genetic diversity based on nuclear DNA CYP2U1 gene do not permit us to make further conclusions; therefore, more research evidence from genetics and archaeology is still required.

Figures & Tables

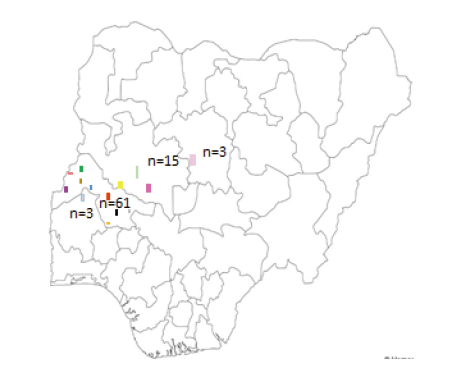
Figure 1. Proportion of individuals sampled from each region with colour indicating the sampling in Kaduna, Kwara, Niger and Oyo States of Nigeria: Blue-ABO; Black-ADE; purple-BART; Red-BDS; Brown-BON; Orange-IDO; White-ILE; Grey-KEY; Light Blue-KIS; Yellow-MOU; Pink-NBS; Lime-NIG; Light Red-OKE; Green-PAT; Light Pink-SAM.