Introduction
Materials and methods
The porcine breeding goals are subject to change and are directed much more toward retail carcass yield and meat quality because of the high economic value of these traits. Pig performance represented by daily gain, feed conversion efficiency, and carcass yield has been improved intensively by selection. On the other hand, stress resistance and meat quality were adversely affected (I. Fiedler et al., 2004). To counteract this development, it is advantageous to consider such characteristics, which are positively related to both muscle growth and meat quality (Lengerken et al., 1994). The candidate traits represented by muscle fiber characteristics such as number, size, number per unit area, and type composition. It was analysed from m. longissimus dorsi of the carcasses (S. Ozawa et al., 2000; Y.C. Ryu and B.C. Kim, 2005). The total number of muscle fiber were positively related to muscle growth potential in pigs (Dwyer, 1993 #13; Stickland, 1973 #11; Stickland, 1978 #12). And the fiber-type composition may be associated with postmortem changes in the conversion of muscle to meat and subsequently meat quality. Because most of the muscle fiber characteristics had medium heritability and significant genetic correlations with growth related traits and meat quality traits, it is possible to account for them in breeding for improved meat quality and growth performance (I. Fiedler et al., 2004; Larzul et al., 1997). For confirmation of these theories, we estimated the heritabilities of muscle fiber traits and correlations between these traits and the other performances. According to their results, it could be applied to the new performance for porcine breeding goals. But, the these traits has one of the critical problem that it could be only measured at porcine carcass muscle. Therefore, the newly molecular markers are needed for selection by muscle fiber traits without slaughter of a breeding pig.
Muscle fiber formation takes place during embryonic development regulated by the MyoD gene family, which consists of four genes, MyoD1, MYOGenin (MYOG), myf-5, and myf-6 (MRF4) (Lyons and Buckingham, 1992; Montarras et al., 1991; Olson, 1990; Weintraub, 1993). MYOG has a crucial role during MYOGenesis. MYOGenin is expressed in all myoblasts from the start of differentiation (i.e., fusion of myoblasts into multinucleated myofibers), and its expression continues during cell fusion. MYOG expression also marks the end of the proliferation of myoblasts. Thus, when MYOG is expressed, muscle fibers develop from the myoblasts that were previously formed. Therefore, different MYOG function or timing of expression could have a major influence on the muscle fiber traits that develop during MYOGenesis (Soumillion et al., 1997; te Pas et al., 1999). The ultimate objective of this study was to investigate the newly molecular marker for improvement of the lean meat production and the meat quality at once. So, we searched the new polymorphism on 5' upstream region of MYOG gene that has a relationship between their genotypes and porcine lean meat production, meat quality and muscle fiber traits.
Animal samples
A total of 253 pigs of Yorkshire (186; 124 gilts and 62 castrated male) and Landrace (67; 37 gilts and 30 castrated male) breeds was evaluated in this study. Yorkshire breed consisted of half-sib families from 22 sires and 60 dams, and Landrace breed consisted of half-sib families from 8 sires and 21 dams. Pigs were slaughtered during three periods at 172.6 ± 5.1d, 174.6 ± 5.4d and 176.8 ± 8.8d, respectively. The backfat thickness was measured at the 11th and last thoracic vertebrae. The mean of these 2 measurements was used as backfat thickness. The loin eye area was measured at the level of the last rib.
Meat quality measurements
Carcasses were chilled at 4°C for 24h and the m. longissimus dorsi was taken to evaluate the meat quality traits. Drip loss was determined by suspending muscle samples standardized for surface area in an inflated plastic bag for 48 h at 2°C (Honikel, 1987). The Lightness(L*) of the meat was measured at the 8th-9th thoracic vertebrae at 24 h postmortem with a chromameter (CR-300, Minolta Camera Co., Japan). The pH value was measured at the location of 13th /14th rib by using a spear-type electrode (Model 290A, Orion Research, Inc., Boston, MA) at 45 min post mortem.
Muscle fiber traits analyses
Within 45 min after slaughter, a sample was taken from longissimus muscle at the 8th thoracic vertebrae. Samples were cut into 0.5 × 0.5 × 1.0 cm pieces, promptly frozen in isopentane cooled by liquid nitrogen, and stored at −80°C until subsequent analyses. Transverse serial sections (10㎛ -thick) were cut in a cryostat instrument (CM1850, Leica, Germany) at -20°C and stained for actomyosin ATPase after acid preincubation (pH 4.35) to identify the type I, IIA, and IIB fibers (Brooke and Kaiser, 1970). All muscle fiber samples were examined by an image analysis system. The operational system consisted of an optical microscope equipped with a charGe-coupled device color camera (IK-642K, Toshiba, Japan) and a standard workstation computer that controls the image analysis system (Image-Pro Plus, Media Cybernetics, Silver Springs, MD). Fiber density was calculated from the mean number of fibers per mm2. For the calculation of the total fiber number, the fiber density was multiplied with the loin eye area (cm2) determined at the level of the last rib (Ryu and Kim, 2006).
Sequencing and detection of polymorphism
Pigs of genomic DNA were isolated from EDTA-treated blood samples following standard procedures (Sambrook et al., 1989) and by using DNA isolation Kit (G-DexTMIIb, Intronbio., korea). The pairs of primers were designed upon the porcine MYOG gene sequence (GenBank, accession number X89007 and U14331). Primers: 5'-GCTCAGAGGACAAGAGTGTAAACC-3' (forward) and 5'-GAAGTAGGGGGATGTCTCATACAG-3' (reverse), at concentrations of 20 pmol each, were used for PCR amplification (Mastercycler gradient, Eppendorf co., Germany) of a fragment of 5' upstream region located between nucleotides -2054 and 30. In a reaction volume of 20 ㎕, 10 ng of genomic DNA, 0.25 mM concentrations of each dNTP, 1x PCR buffer, and 1.25 U DNA polymerase (i-MaxTM II, Intronbio., Korea) were used with the following temperature profile: 94℃ for 10 min, 35 cycles of 94℃ for 1 min, 65℃ for 1 min, 72℃ for 3 min and a final extension of 72℃ for 30 min. PCR products were purified by using QIAgen PCR purification kit 250 (Qiagen, Korea). Sequencing was performed on the autosequencing system (Applied Biosystems, Foster City, CA, USA).
PCR restriction fragment length polymorphism genotyping
PCR restriction fragment length polymorphism (RFLP) was used for genotyping the animals. PCR product was generated with primers:
5'-GTTCACCTTCCTGTATTGGGAACACT-3' (forward) and 5'-CTTAGGTCTCATGTGACTGGGGATA-3' (reverse), was approximately 680 bp in length. Pairs of specific primers including newly polymorphism were designed upon above sequence. PCR was carried out in a 50㎕reaction mixture containing 30 ng of genomic DNA, 0.25 mM concentrations of each dNTP, 1x PCR buffer, and 2.5 U DNA polymerase (i-MaxTM II, Intronbio., Korea) and 20 pmol of each primer. Amplification conditions were: 94℃ for 15 min, 35 cycles of 94℃ for 1 min, 60℃ for 1 min, 72℃ for 1 min and a final extension of 72℃ for 15 min. Three microlitres of the PCR reaction mixture was added to 12.0 ㎕ of a reaction mix containing 2.5 U of restriction endonuclease BspCNI (New England Biolabs, Seoul, Korea). Digestion was carried out overnight at 25°C and fragments were separated by gel electrophoresis on 10% (19 : 1) acrylamide : bisacrylamide gels in 1x TBE buffer at 300 V for 40 min.
Statistical alalysis
Estimates of variance and covariance components were obtained using an animal model and computed with the multiple-trait, derivative-free REML program (Boldman et al., 1995). The estimates of covariance components were used above all to obtain estimates for heritabilities and for genetic correlation coefficients between muscle fiber characteristics and others traits. The muscle fiber number was analyzed after a log transformation to obtain a normally distributed trait. The following model was used for analysis of the data:
y = Xb + Za + e
where y is a vector of observations corresponding to the trait(s) traits, b is a vector of fixed effects for the trait, a is a vector of random additive genetic effects, and e is a vector of residual effects, X is and incidence matrix relating observations to fixed effects, and Z is an incidence matrix relating observations to random additive genetic effects. Fixed effects were sire, breed, sex and period of slaughter for all other traits; in addition, the age at slaughter were used as covariates for other traits.
The general linear model procedure was performed for the association between genotypes and traits, using the statistical software package SAS 9.13 (SAS Institute Inc., 2001). Breed, sex, period of slaughter and the genotypes were included in the analyses as fixed effects. When significant differences (P < 0.05) were detected, the mean values were separated by the probability difference (PDIFF) option at a predetermined probability rate of 5%. The results were presented as least squares means for the groups together with the standard errors of these least squares means.
Results and Discussion
Means and heritabilities
The number of measurements per trait, abbreviations and means with their standard deviations was shown in Table 1. Also, heritability estimates with standard error were presented in it. But, not all traits were measured on all indivifuals because of misobservations, time limits, etc.
|
Table 1. Summary statistics for traits, heritabilities (h2) and their SE for muscle fiber traits, meat quality, lean meat production and muscle fiber traits 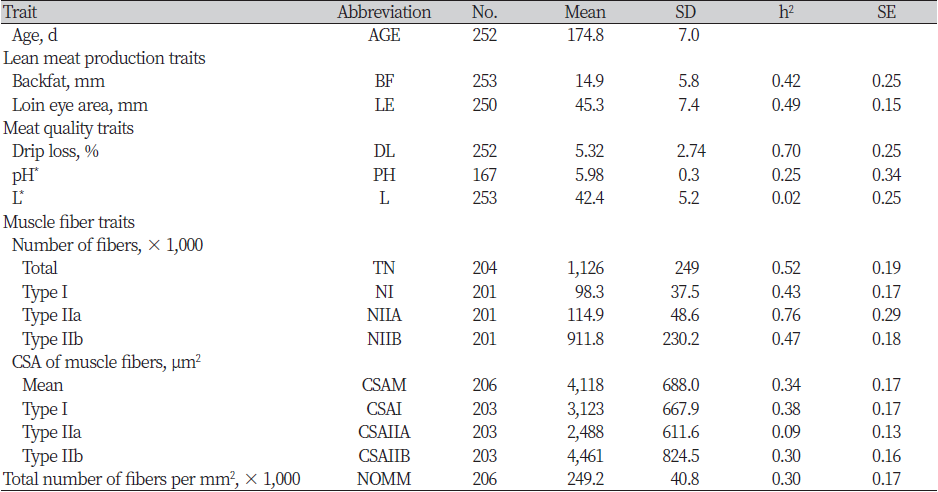
|
The average age of slaughters (AGE) were 174.8d. The average backfat thickness (BF) and loin eye area (LE) were 14.9 and 45.3 mm, respectively. Heritability estimates for lean meat production traits consisted of BF and LE were h2 = 0.42 and 0.49, respectively. Although, the heritability of BF was lower than 0.67 estimated by (Larzul, 1997 #3) and 0.45 estimated by (van Wijk, 2005 #5), but, it was higher than 0.40 estimated by (Newcom, 2002 #6). Also, the heritability of LE was within the range of published estimates by them. So, our results that was about heritability estimates for lean meat production traits were moderate to high compare with the other published heritability estimates.
The meat quality traits were in normal range (drip loss: 5.32%, pH value: 5.98), except of lightness with 42.4. The heritability of meat quality traits were very low to very high (h2 = 0.02 to 0.70). The heritability estimate for drip loss (DL) of 0.70 was very higher than estimates presented by (Fiedler, 2004 #2; Suzuki, 2005 #7; van Wijk, 2005 #5) of 0.17, 0.14 and 0.08, respectively. (Hovenier, 1993 #8) reviewed a wide range of heritability estimates for water-holding capacity included cooking loss from 0.00 to 0.63, probably because of the different methods used to measure the trait in their review. Heritability estimate for muscle pH (PH) was medium (h2 = 0.25). In the present study, the heritability estimates of this trait were very low to medium (h2 = 0.07 to 0.32). The heritability estimate for lightness (L*) was the least (h2 = 0.02) in previous studies.
The muscle fiber traits were examined by muscle cross-section. The type of muscle fibers were divided by type I, IIa, and IIb. The most number of muscle fiber was type IIb (NIIB) with 912 (×1,000). Type I (NI) and IIa (NIIA) were 98 and 115, respectively. So, a total number of fiber (TN) was 1,126. The average of cross-sectional area of muscle fibers were 4,118㎛2, and the total number of muscle fibers per mm2 were 249 (×1,000). Heritability estimates of muscle fiber traits ranged from moderate to high, except to CSAIIA (h2 = 0.09). The heritability of TN (h2 = 0.52) was higher than previous estimates by (Larzul, 1997 #3) (h2 = 0.22) and (Fiedler, 2004 #2) (h2 = 0.28). These authors used fiber percentages for the heritability estimate, but we used real value of each fiber types. The heritability estimates for NI, NIIA, and NIIB were very high (h2 = 0.43, 0.76 and 0.46, respectively). Heritability of mean cross-sectional area (CSAM) was medium (h2 = 0.34), with a similar heritability to reported by (Larzul, 1997 #3). CSA of muscle fiber type I and IIb (h2 = 0.38 and 0.30, respectively) were medium, too.
Genetic and Phenotypic Correlations
Table 2 shows the genetic and phenotypic correlation between lean meat production and meat quality traits and muscle fiber traits. Genotypic correlations between BF and muscle fiber traits were low to high (rG = -0.17 to 0.85). But, low phenotypic correlations between BF and muscle fiber traits were found (rp = -0.05 to 0.19). The charGe of genetic and phenotypic correlations between BF and number of fibers were all difference. A negative genetic correlation was observed between BF and TN (rG = -0.22). With the exception of NI (rG = 0.31), negative genetic correlations were observed between BF and number of other fiber types (rG = -0.69 to -0.17). Moreover, genetic and phenotypic correlations between BF and NOMM were negative (-0.47 and -0.09, respectively). In contrast with number of fibers, close positive genetic correlations were observed between BF and CSA of fibers (rG = 0.30 to 0.85). This results were diametrically opposed to the results reported by (Larzul, 1997 #3). They showed that genetic and phenotypic correlations between BF and CSA of fibers were all negative (rG = -0.09 to -0.28 and rp = -0.17 to -0.51). These differences of results suggest that breed and measurement differences might influence the genetic and phenotypic correlation.
Significant phenotypic correlations between LE and number of fibers were observed (rp = 0.21 to 0.67, p < 0.001). Genetic correlations between LE and number of fibers, too, were very close (rG = 0.55 to 0.76), although NIIA was related negatively to LE (rG = -0.45). Whereas, no significant phenotypic relationship between LE and CSA of fibers (rp = 0.03 to 0.12) or NOMM (rp = -0.13). In addition, CSA of fibers and NOMM were weakly genetic correlated with LE, except with CSAI (rG = -0.50). Positive high genetic correlation was estimated for LE with TN (rG = 0.76), in agreement with the results presented by (Fiedler, 2004 #2; Larzul, 1997 #3). Moreover, our results estimated that TN were not only genetic correlated but positively high phenotypic correlated with LE. But, the genetic correlation between LE and CSAM was no relationship (rG = 0.07).
Drip loss was positively related to TN (rG = 0.37 and rp = 0.25 ) and NI (rG = 0.20 and rp = 0.15) and negatively related to NIIA (rG = -0.67 and rp = -0.10). Moreover, DL was negatively related to the CSAM (rG = -0.17 and rp = -0.09), CSAI (rG = -0.83 and rp = -0.14), CSAIIA (rG = -0.67 and rp = -0.05) and CSAIIB (rG = -0.12 and rp = -0.11). Previous results reported controversial values for genetic correlations between DL and TN (rG = -0.05) or CSAM (rG = 0.64), by (Fiedler, 2004 #2). These differences of results suggest that the small of sample size in our study and differences of breed might influence the genetic correlation and theirs standard error. No clear genetic relationship between DL and NOMM were observed (rG = 0.06).
Muscle pH was negativly related to the TN (rG = -0.25 and rp = -0.16), the NIIA (rG = -0.52 and rp = 0.02) and NIIB (rG = -0.45 and rp = -0.19), while NI was unrelated (rG = 0.01 and rp = -0.04). But, the other genetic correlations were not estimated. And their phenotypic correlations were very low (rp = -0.08 to 0.15).
Lightness was genetic correlated positively to muscle fiber number (rG = 0.10 to 0.62), CSAIIA (rG = 0.14) and CSAIIB (rG = 0.22) and negatively to CSAI (rG = -0.75) and unrelated to CSAM (rG = -0.02).
Whereas no clear phenotypic relationship between lightness and muscle fiber number, except of NI (rp = 0.16, p < 0.05). Moreover, lightness was no clear phenotypic related to CSA fiber types, except of CSAI (rp = -0.17, p < 0.05).
As a whole, the present results suggest that selection for increased TN and NIIB could be decreased backfat thickness and could be increased loin eye area. But, it could be increased drip loss and lightness and decreased pH at 45 min. And, selection for decreased CSAI increased drip loss and lightness and decreased pH at 45 min. Selection for increased NOMM decreased backfat thickness without changing the loin eye area, and it might no influence in meat quality without lightness. In other words, we suggest that the porcine lean meat production could be improved as selection for TN, NIIB, CSAI, and NOMM, while they affected to meat quality differently. And, we estimate that these traits could be used the newly marker traits for the improved lean meat production without changing the meat quality.
Polymorphism
te Pas and A.H. Visscher (1994) hypothesized that naturally occurring genetic variation in MYOG could affect muscle fiber numbers and, thus, lean production characteristics. A role of MYOG is the start of differentiation from myoblast into multinucleated myofibers by cell fusion. If the onset of MYOG gene expression is delayed because of variation in the regulatory sequences, myoblast proliferation could continue longer and increase the number of myoblast (Coutinho et al., 1993), and it lead to greater lean production (te Pas et al., 1999). Actually, the genetic variation in the porcine MYOG gene locus has many reported (Mendez et al., 1997; Soumillion et al., 1997; Wyszynska-Koko and Kuryl, 2005).
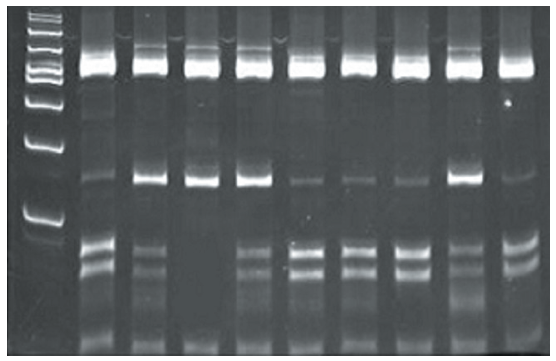
We identified the new polymorphic site as T/C transition at position -1250 bp in 5' upstream region of MYOG gene by sequencing. The polymorphism could be genotyped with restriction endonucleases BspCNI and BseMII. Allele T is characterized by digestion of the 676 bp PCR product to fragments 463, 150, 44 and 18 bp, while allele C with a polymorphic restriction site is represented by fragments 463, 82, 68, 44 and 18 bp (Figure 1).
|
Table 3. Genotype and allele frequency of porcine MYOG 5' upstream region by PCR-RFLP analysis |
|
N, () = number of animal |
A total of 253 pigs of Yorkshire (n=186) and Landrace (n=67) were tested in order to establish the SNP frequencies of genotype and gene in these breeds (Table 3). The frequencies of TC genotype in both breeds was lower than CC genotype. C allelic frequencies were near the same as 0.86 in Yorkshire breed, 0.79 in Landrace breed. The frequencies in total of pigs are 0.84. But, the frequency of TT genotype were near the zero (0.03). Actually, Pigs that was estimated TT genotype are only two in both breeds. So association statistical analysis for genotypes were performed with the exception of TT genotype.
Associassion between genotypes and muscle fiber traits and the other performance
Results of the association statistical analyses in 253 animals of Yorkshire and Landrace breeds are presented in Table 4. Associations between genotype of 5' upstream region of MYOG gene and backfat thickness (mm) were highly significant (P <0.002), with the TC genotype animals having less backfat thickness than CC animals. Loin eye area (cm2) were lowly significant (P < 0.07), with TC animals having more than CC. These results suggest that TC genotype animals could be lead to less backfat thickness, and higher loin eye area. Therefore, the TC genotype animals had better lean meat production traits than CC genotype animals. There were no significant effects between genotype and meat quality traits consisted of drip loss (%), pH value at 45 minute from slaughter and Lightness (L*).
Most of muscle fiber traits consisted of total fiber number, mean number of fibers per mm2 and fiber density are no significant different between genotypes except of total fiber number. Although total muscle fiber number were lowly significant (P < 0.08), the TC genotype animals had more total muscle fiber number than CC genotype. Type IIb among them were lowly significant (P < 0.07), with TC genotype having more than CC. So, we could be guess that the TC genotype animals have more improvement of muscle fiber traits than the CC genotype animals.
Joining the results, we suggests that the newly discovered SNP at 5' upstream region of MYOG affect to the related porcine lean meat production, and it has no significant effect for meat quality. According to that, it could be importanted for porcine breeding. If do that is selection for the TC genotype animals, it could be obtain the improvement the lean meat production without affecting meat quality. In other words, Marker-assisted selection by using relatively low frequency of the TC genotype in pigs can be much improvement of porcine industry.