Introduction
After the publication of a draft human genome sequence in 2003, genome projects for various species were carried out. As a result, reference genome sequences have been elucidated for a total of 49,286 living organisms to date (https://www.ncbi.nlm.nih.gov/genome/browse/#!/overview/). Furthermore, with the rapid development of next-generation sequencing (NGS) technology, the time and cost needed to produce reads and libraries for new species have been reduced dramatically (Kong et al., 2019). Furthermore, existing genome sequences are constantly being supplemented with new information.
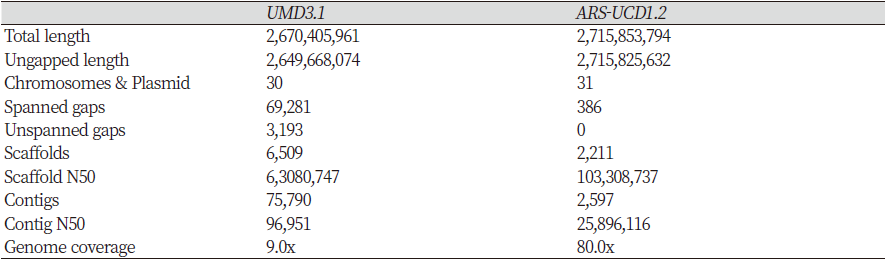
UMD3.1, a previous version of the Bos taurus reference genome, was released by the Center for Bioinformatics and Computational Biology (NCBI) of the University of Maryland in December 2009. It was sequenced using the BAC-by-BAC hierarchical method and whole-genome shotgun methods and then aligned using Celera Assembler version 5.2. According to the summary statistics for the references reported in Ensembl (Chen et al., 2010), in the newer ARS-UCD1.2 reference genome, the total length and ungapped region length have increased by 45,447,833 (1.70%) and 66,157,558 (2.50%) bp, respectively, compared to the previous version (Table 1). By contrast, the number of scaffolds and contigs have decreased by 4,298 (66.03%) and 73,193 (96.57%) bp, respectively. However, the scaffold N50 and contig N50 increased 1.64- and 267.11-fold, respectively. In addition, the genome coverage in UMD3.1 is 9.0x versus 80.0x in ARS-UCD1.2. Thus, the ARS-UCD1.2 genome has an approximately nine-fold greater depth compared to the UMD3.1 genome. Therefore, the most recent sequence appears to be more accurate, and we should expect to obtain better results using it in genome-wide association studies (GWAS), for example.
The BovineSNP50 BeadChip, developed for use with the Illumina system, is widely used for the prediction of genetic ability and in GWAS and genetic diversity studies based on genomic information for various cattle breeds. This single-nucleotide polymorphism (SNP) panel has been used for genomic prediction analysis in Nelore cattle (Boddhireddy, Prayaga, Barros, Lôbo, & DeNise, 2014), and in a GWAS of oleic acid and fatty acid composition in Japanese black cattle (Uemoto et al., 2011). In this SNP panel, more than half of the probes were designed using known genome-wide SNPs and Illumina sequencing of data from publicly available sources, such as bovine reference sequences, Btau, and the Bovine HapMap Consortium (https://www.illumina.com/documents/products/datasheets/datasheet_bovineLD.pdf). The chip has been updated from version 1 to 3; the reference sequence is also constantly being updated. In contrast to Btau 2.0, both the Bovine LD v2.0 Genotyping BeadChip and BovineSNP50 v3 BeadChip were developed based on six cattle types: Norwegian Red, Holstein, Brahman, Angus, Jersey, and Limousin. In 2019, the National Institute of Animal Science in South Korea developed the Hanwoo BeadChip v1, which is a SNP chip designed specifically for the Hanwoo breed (https://www.korea.kr/news/pressReleaseView.do?newsId=156250636). This SNP panel incorporates features of previous versions of the Illumina Bovine BeadChip array to allow use in Hanwoo and various cattle breeds. In addition, the panel contains additional SNP information from the whole-genome sequence of Hanwoo bulls and candidate SNPs related to 24 genetic diseases. Approximately one-third of the genetic information in the commercial chips, which was not relevant to the Hanwoo breed, was removed. Then, 4,762 population-specific, 4,383 carcass-related, and 44 genetic disease-related SNP markers were added to supplement the Hanwoo-related information.
In this study, SNPs in three panels were subjected to lift-over analysis to determine whether there had been any changes in location based on the latest reference genome, ARS-UCD1.2. Successfully remapped variants were annotated with reference to both UMD3.1 and ARS-UCD1.2 to obtain genetic information. We then compared the genomic information between ARS-UCD1.2 and UMD3.1 for each panel.
Materials and Methods
1. Animals and genotypes
A total of 4,091 Hanwoo samples were used for genotyping in this study. SNP genotyping was conducted using the Bovine LD v2.0 Genotyping BeadChip (Bovine v2), BovineSNP50 v3 BeadChip (Bovine v3), and Hanwoo BeadChip v2 (Hanwoo v1). Bovine v2 contained an array of 54,609 SNPs and was used to analyze 341 of the 4,091 samples. Bovine v3 and Hanwoo v1 contained 53,218 and 53,866 variants and were used to genotype 100 and 3,650 samples, respectively. Reference sequence FASTA files and GTF annotation files for the UMD3.1 and ARS-UCD1.2 assemblies were downloaded from the Ensembl database (Chen et al., 2010).
2. Lift-over
PLINK binary files for Hanwoo v1, Bovine v2, and Bovine v3 were converted into variant calling format (VCF) using the recode option in PLINK 1.9 software (Purcell et al., 2007) for lift-over analysis. As the SNP chips were developed based on the UMD3.1 assembly, the positions of variants should be updated to match those in the latest version (ARS-UCD1.2). To search for SNPs in the new reference genome, we used the Picard LiftoverVcf tool (https://broadinstitute.github.io/picard/). To assess shifts in the locations of variants, a chain file was downloaded from the UCSC Genome Browser website (Kent et al., 2002). Its pairwise alignment allows gaps in both sequences, ARS-UCD1.2 and UMD3.1, at the same time. Each set of chain alignments starts with a header line, includes one or more alignment data lines, and ends with a blank line; thus, the format is relatively dense.
3. Annotations
To compare the variants common to UMD3.1 and ARS-UCD1.2, variants that had successfully passed the lift-over procedure were extracted from the original sequence (UMD3.1) using R software and PLINK 1.9. Next, we functionally annotated only autosomes from the lifted-over SNPs using the SnpEff program (Cingolani et al., 2012). Data on these variants and the functional annotations were stored in HTML summary documents and VCF files. The SNP panels were then compared based on this information using R software.
Results
1. Comparison of the number of variants in each SNP panel before and after lift-over
In total, 47,450 SNPs were identified as common among the three panels (Hanwoo v1, Bovine v2, and Bovine v3). The number of SNPs not shared between each pair of panels ranged from 64 to 3,458. Hanwoo v1 and Bovine v2 do not share 4,042 and 3,637 SNPs, respectively, with the other panels. Bovine v3 contains all SNPs found in all panels except for 64 variants, which are only included in Hanwoo v1 and Bovine v2 (Figure 1).
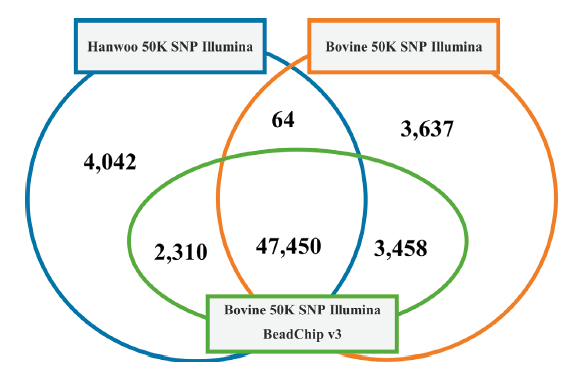
Fig. 1. Structure of Hanwoo 50K SNP Illumina BeadChip v1, Bovine 50K SNP Illumina BeadChip v2 and Bovine 50K SNP Illumina BeadChip v3. 47,450 SNPs were identified as common among the three panels (Hanwoo v1, Bovine v2, and Bovine v3). Each pair of panels shares SNPs ranged from 64 to 3,458. Hanwoo v1 and Bovine v2 do not shared 4,042 and 3,637, respectively, with the other panels.
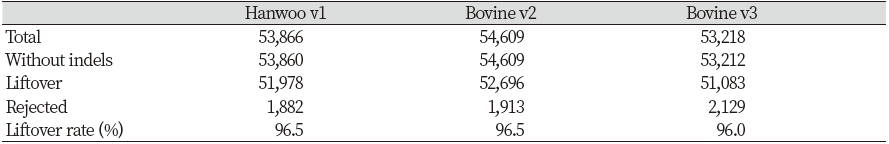
The variants in each panel were subjected to lift-over analysis using the Picard LiftoverVcf tool. The results showed that 51,978 of 53,866 variants in Hanwoo v1, 52,696 of 54,609 variants in Bovine v2, and 51,083 of 53,218 variants in Bovine v3 could be located in the ARS-UCD1.2 assembly (Table 2). The locations of the rest of the SNPs in the current reference were not identified due to incompatibility between the previous and current references.
2. Summary of annotation results for each panel according to the references
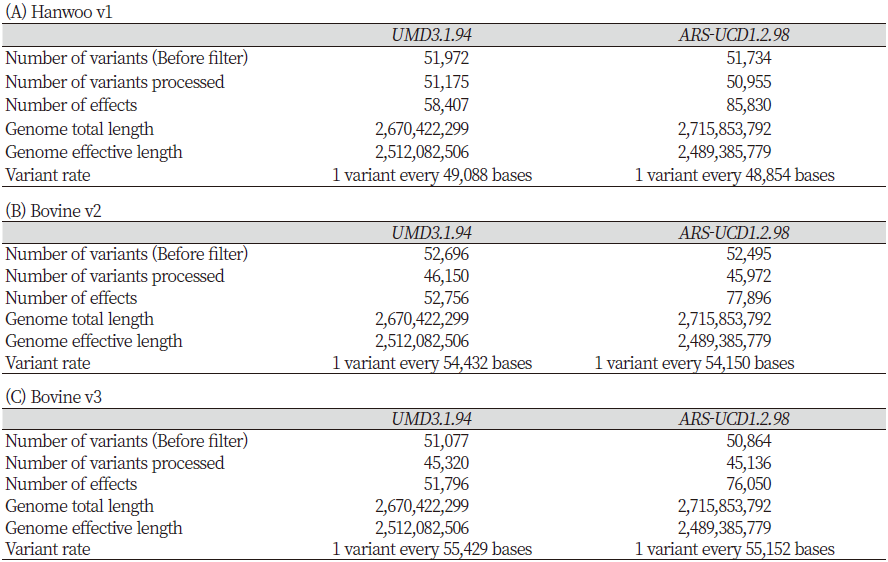
For Hanwoo v1 in ARS-UCD1.2, 50,955 of 51,734 variants passed the SnpEff filter and were annotated. The total number of functional effects increased by 27,423 (46.95%) when ARS-UCD1.2 (n = 85,830) was used as the reference genome rather than UMD3.1 (n = 58,407). In addition, in UMD3.1, genetic variants were identified every 49,088 bp in the entire genome, while in ARS-UCD1.2 SNPs were found every 48,854 bp (Table 3-A). For Bovine v2, 45,972 of 52,495 variants were annotated. When ARS-UCD1.2 was used instead of UMD3.1, the number of functional effects increased by 25,140 (47.65%; n = 77,896 and 52,756, respectively). Also, the SNP frequency changed from 1 every 54,432 bp to 1 every 54,150 bp (Table 3-B). For Bovine v3, 45,136 of 50,864 variants passed the filter and were annotated (Table 3-C). The number of predicted effects increased by 24,254 (46.83%) when ARS-UCD1.2 (n = 76,050) was used instead of UMD3.1 (n = 51,796).
3. Variants that affect protein expression
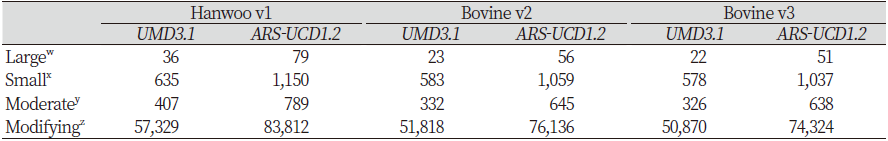
In the SnpEff results file, effects were classified according to their impact on proteins. Variants were classified according to whether they had large, small, moderate, or modifying effects. Large effects cause protein modification, whereas small effects are harmless or cause little protein deformation. Moderate-effect variants are non-disruptive but cause protein transformation, whereas modifying variants affect non-coding variants and genes. For Hanwoo v1, when ARS-UCD1.2 was used, the number of large, small, moderate, and modifying effects increased by 43 (119.44%), 515 (81.10%), 382 (93.86%), and 26,483 (46.19%), respectively. For Bovine v2, the number of large, small, moderate, and modifying effects increased by 33 (143.48%), 476 (81.65%), 313 (94.28%), and 24,318 (46.93%), respectively. For Bovine v3, the number of large, small, moderate, and modifying effects increased by 29 (131.82%), 459 (79.41%), 312 (95.71%), and 23,454 (46.11%), respectively. The overall number of effects mapped to the ARS-UCD1.2 reference was higher than UMD3.1. In all arrays, most of the variants mapped to both genome assemblies have modifying effects, followed by those with small, moderate, and large effects (Table 4).
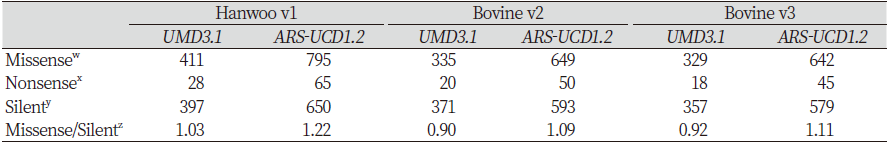
The effects could also be classified by function, i.e., missense, nonsense, or silent effects. Missense effects cause amino acid changes, while nonsense effects result in the formation of the stop codon, and silent effects have no effect on amino acid synthesis. When variants in Hanwoo v1 were mapped to the current reference, the number of missense, nonsense and silent effects increased by 384 (93.43%), 37 (132.14%), and 253 (63.73%), respectively. The missense/silent ratio increased from 1.03% to 1.22%. For Bovine v2, the number of missense, nonsense, and silent effects increased by 314 (93.73%), 30 (150.00%), and 222 (59.84%), respectively. The missense/silent ratio increased from 0.90% to 1.09%. As with Bovine v2, nonsense effects were found for Bovine v3 after mapping, and the number of missense and silent effects increased by approximately 95.14% and 62.18%, respectively. Similarly, the missense/silent ratio increased from 0.92 to1.11. Overall, the missense/silent ratio increased slightly, and the number of effects for each functional class also increased (Table 5).
4. Effects by SNP type
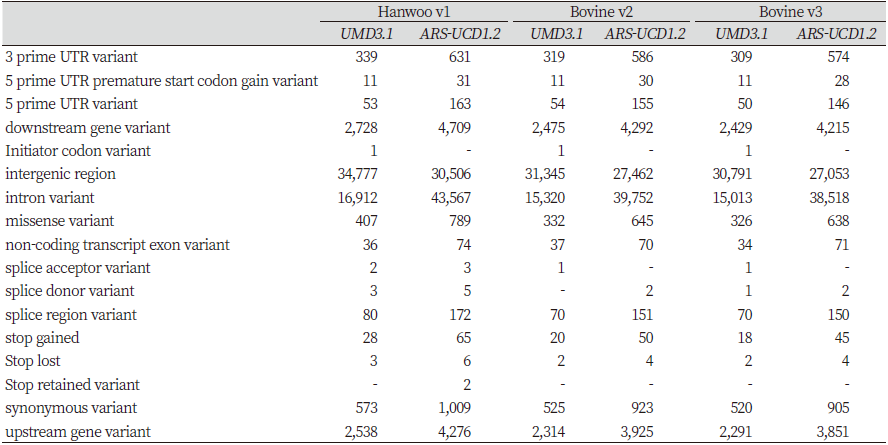
For Hanwoo v1, 34,777 (59.46%) effects were found in intergenic regions, and 16,912 (28.91%) effects were found in intron regions, when the UMD3.1 reference was used, compared to 30,506 (35.47%) and 43,567 (50.66%) effects, respectively, for ARS-UCD1.2. Thus, the number of variants of ARS-UCD1.2 in intergenic regions decreased by 4,271, whereas that in intron regions increased by 26,655. For Bovine v2, 31,345 (59.34%) SNPs were found in intergenic regions, and 15,320 (29.00%) in intron regions, with the use of UMD3.1. Using ARS-UCD1.2 as the reference, the respective number of SNPs was 27,462 (35.19%) and 39,752 (50.93%). Therefore, the number of SNPs in intergenic regions decreased by 3,883, and that in intron regions increased by 24,432. For Bovine v3, 30,791 (59.37%) and 15,013 (28.95%) mutations were found in the intergenic and intron regions, respectively, with UMD3.1, whereas 27,053 (35.50%) and 38,518 (50.55%) mutations were found, respectively, with ARS-UCD1.2. With the latter reference, the number of mutations in intergenic regions decreased by 3,738, and that in intron regions increased by 23,505.
For the three panels, the proportion of variants found in intergenic and intron regions was approximately 59.39% and 28.95%, respectively, when mapping was conducted using the UMD3.1 reference. However, when the SNPs were annotated based on ARS-UCD1.2, approximately 35.39% of the effects were found in intergenic regions and 50.71% in intron regions. Altogether, the number of mutations in intergenic regions decreased, with a concurrent increase in intron regions. Furthermore, minor changes and genetic variations were observed in other regions (Table 6).
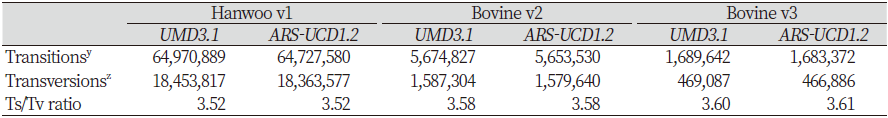
Functional effects can also be categorized as causing transition or transversion. A transition is a mutation that changes from pyrimidine to pyrimidine base or purine to purine base, whereas transversion is a variant of a pyrimidine-to-purine base or purine-to-pyrimidine base. In the annotation result, the numbers of transitions and transversions are different between two references in all three panels. However, the conversion/transversion variant ratios were almost the same (Table 7).
5. Location changes in Hanwoo economic trait-related candidate genes between the references
To assess changes in physical position and information, the distributions of the PLAG1, ACSS2, and CAST gene locations, as well as information on genetic variations, were confirmed. These well-known candidate genes were associated with the economic traits of the Hanwoo breed in previous studies. The positions of the genes were verified using reference GTF annotation files downloaded from Ensembl.
The PLAG1 (PLAG1 zinc finger) gene is reportedly significantly associated with the carcass weight of Hanwoo cattle (S. H. Lee et al., 2012). It is located on chromosome 14 in the 25,007,291–25,009,296 bp region (length, 2,005 bp). For Hanwoo v1, upon annotating using UMD3.1, one variant in the gene’s downstream region (14:25,003,338) was found. In ARS-UCD1.2, both the locations of the gene and variant changed. In this reference genome, PLAG1 is located in chromosome 14 in the 23,330,541–23,375,751 bp region (45,210 bp). The SNP, located in the downstream region of UMD3.1, moved to the 14:23,326,588 position of ARS-UCD1.2, still downstream of the PLAG1 gene. No mutations in the PLAG1 gene were detected with the other panels, regardless of the reference used (Figure 2-A).
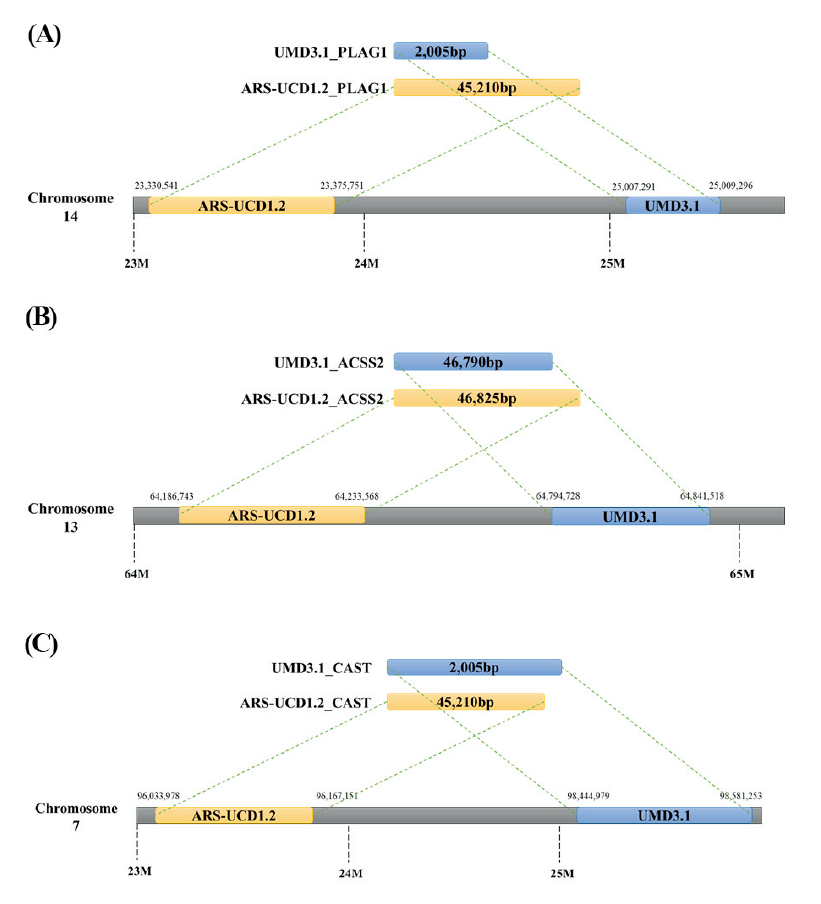
Fig.2. Gene position change according to reference genomes. In this figure, the blue box represents the gene for the genome and the yellow box for ARS-UCD1.2 genome. And the gray box is the genome of the chromosomes. As shown in this figure, the size and the location of the gene are changed according to the reference genomes. Due to these changes, the number and the location of SNPs are changed.
The ACSS2 (acetyl-CoA synthetase short chain family member 2) gene is reportedly important in the Hanwoo marbling score (Kim et al., 2008). The location of this gene shifted from the 64,794,728 - 64,841,518 bp region (46,790 bp) in chromosome 13 to the 64,186,743 - 64,233,568 bp region (46,825 bp). The annotation results for the three panels indicated one intron (13:64,804,947) and one synonymous variant (13:64,840,460) in the gene with UMD3.1 as the reference. The locations of these SNPs shifted to positions 64,196,996 and 64,232,510, respectively, and were still found within the ACSS2 gene (Figure 2-B).
Finally, the CAST (calpastatin) gene is associated with meat tenderness (S.-H. Lee et al., 2014) and is located in the 98,444,979 - 98,581,253 bp region (136,274 bp) in chromosome 7 with UMD3.1 as the reference. However, its location shifted to the 96,033,978 - 96,167,151 bp region (133,173 bp) in the same chromosome of the current reference. The annotation results for the three panels indicated the presence of two intron variants and one missense variant, which are located at 7:98498047, 98566391, and 7:98534197, with UMD3.1 as the reference. In ARS-UCD1.2, these variants are moved to 7:96087310, 7:96152289, and 7:96119746 (Figure 2-C).
According to the above results, the locations and sizes of the genes changed according to the reference used. In addition, the physical positions and genetic information of all SNPs annotated in the three panels changed when the updated reference genome was used.
Discussion
This study was conducted to confirm differences in genetic information when two different cattle genome sequences, UMD3.1 and ARS-UCD1.2, are used. In addition, we tracked how information on SNPs changed with the use of an updated reference genome and different types of array panels.
1. Differences in the reference genome
The overall length and ungapped length of ARS-UCD1.2 increased compared to UMD3.1. In particular, the scaffold N50 and contig N50 for ARS-UCD1.2 are approximately 1.63-fold and 267.11-fold higher, respectively, indicating an improvement in the quality of the sequence (Table 1). The differences are likely due to advancements in sequencing technology. For example, UMD3.1 was assembled using Sanger sequencing technology, whereas ARS-UCD1.2 was developed using NGS technologies such as PacBio and the Illumina platforms NextSeq 500, Illumina HiSeq, and Illumina GAII. The NGS method represents an improvement over Sanger sequencing, with higher accuracy and the ability to process massive volumes of DNA in a single session (Grada & Weinbrecht, 2013). As a result, the ARS-UCD1.2 genome coverage is approximately nine times larger than the UMD3.1 sequence. Highly reliable SNP and indel calls can be made due to the 20-fold greater depth of NGS data. In addition, the accuracy and quality of mapping have been improved not only for annotation but also for imputation (Muzzey, Evans, & Lieber, 2015; Nicolazzi et al., 2019). Mapping the three panels to the two reference genomes showed that the genome total length increased by 45,431,493 bp (1.70%). However, the effective genome length decreased by 22,696,727 bp (0.90%) for three panels. The current reference is associated with fewer instances of haplotype non-inheritance, suggesting that it better matches true DNA sequences (Null, VanRaden, Rosen, O'Connell, & Bickhart, 2019). Therefore, ARS-UCD1.2 is may a much more accurate sequence compared to UMD3.1.
2. Differences in SNP panel information according to reference genome annotations
Illumina developed the Bovine LD v2.0 Genotyping BeadChip (Bovine v2) with 54,609 SNPs for cost-effective bovine genotyping (https://www.illumina.com/documents/products/datasheets/datasheet_bovineLD.pdf) (Gunderson, Steemers, Lee, Mendoza, & Chee, 2005). The BovineSNP50 v3 BeadChip (Bovine v3) is an upgrade version of Bovine v2, which has additional features such as parentage markers identified by researchers from the US Meat Animal Research Center and US Department of Agriculture Agricultural Research Service (ARS). They compared Holstein bacterial artificial chromosome (BAC) sequence data to the bovine genome assembly (https://www.illumina.com/content/dam/illumina-marketing/documents/products/datasheets/datasheet_bovine_snp5O.pdf) (Heaton et al., 2005). In South Korea, the National Institute of Animal Science developed the Hanwoo BeadChip v1 (Hanwoo v1) for customized studies of the Hanwoo breed. To this chip, 44 markers for 24 hereditary diseases, such as abortion, achondrogenesis, and arthrogryposis, and 4,383 markers related to carcass traits of Hanwoo bulls were added (https://www.korea.kr/news/pressReleaseView.do?newsId=156250636). After lift-over process, approximately 96.5%, 96.5%, and 96.0% of the SNPs in Hanwoo v1, Bovine v2, and Bovine v3 could be located in ARS-UCD1.2. The change tendencies in genetic information were similar among the three panels.
3. Changes in SNP information related to amino acids and proteins
The increase in the missense/silent ratio indicates a corresponding increase in the number of genetic mutations affecting amino acid synthesis. Furthermore, when genetic variations were classified according to SNP type, the number of SNPs in intergenic areas decreased, whereas in intron regions increased. Especially, genetic variations in intron regions can have significant effects on alternative splicing (Talerico & Berget, 1990). Therefore, it is necessary to map genetic variations related to the production of amino acids, including intron and intergenic variants, again to check if they are still relevant.
4. Changes in the genetic information of Hanwoo phenotype-related candidate genes
This study identified changes in genetic information by targeting three candidate genes (PLAG1, ACSS2, and CAST) related to the economic traits of Hanwoo cattle. These genes mapped to both UMD3.1 and ARS-UCD1.2 in Hanwoo v1. However, the locations and sizes of the genes differed between the two reference genomes. In addition, the number and types of genetic variants located in the current reference genome also changed with these changes. In a wide-ranging study, the CPAMD8 gene, associated with congenital Morgagnian cataracts in Holstein calves, was mapped to the whole genome using SAS version 9.4. In the UMD3.1 reference genome used in this study, the CPAMD8 gene is located in the 5,995,888–6,095,676 bp region in chromosome 7. But the ARS-UCD1.2 reference genome is located in the 6,073,378–6,174,087 bp region in the same chromosome (Braun et al., 2019). As the reference sequence has been updated, the genetic information associated with the sequence has changed completely. Therefore, mapping in previous studies using UMD3.1 may need to be re-analyzed using ARS-UCD1.2, and the results should be compared. As the genetic information differs between the two references, it is recommended that only a single reference be used for analysis.
Conclusion
Microarrays mapped to the UMD3.1 reference genome were remapped to the ARS-UCD1.2 version, achieving 96.0-96.5%. As a result, the number of SNPs affecting protein expression, the number of effects by SNP type, and the location of candidate genes related to Hanwoo economic traits were different between the reference genomes. Therefore, the map file of UMD3.1-based SNP chip data needs to update and use the location information of ARS-UCD1.2, a new reference genome, for accurate comparison with other currently published studies.