Introduction
The selection of economically important traits in livestock has been regularly analyzed using phenotypic data. Artificial insemination has been practiced using superior genetic quality bulls since 1960. And from 1987, the Korean proven bull No (KPN) selection has been carried out through progeny testing, resulting in substantial genetic gains (NIAS, 2012). Furthermore, recent advances in genomics have made it possible to analyze the genome genetic structure (Bovine HapMap, 2009). Currently, a technique that utilizes genomic information to evaluate the genetic ability of each animal using a single nucleotide polymorphism (SNP) chip is being highly commercialized. Whole-genome SNP chips are widely used to study genetic diversity and are regularly applied in animal breeding (McKay et al., 2008; Ben et al., 2015). Genomic selection (GS) studies and quantitative trait loci (QTL) search using genotype information for approximately 50,000 SNP markers in the genome are being conducted for domestic and international cattle breed using the 50 K Illumina Bovine Beadchip (Sved, 1971, Hayes, 2008, VanRaden et al., 2009).
Linkage disequilibrium (LD) is a non-random association between alleles at different loci within a population (Weir and Ott, 1997). LD estimation is used to expand breeding and individual selection effects by estimating the genetic recombination possibility within a population. Thus, it is used to validate the QTL search and GS (McRae et al., 2007; Qanbari et al., 2010). In addition, the LD structure in a population is critical for explaining and applying the results of the genome-wide association studies (GWAS) and GS economic traits improvement (Goddard et al., 2009; Habier, 2010). Thus, recent studies explained the relation between the factors (GS, QTL, GWAS, etc.) and LD. Most studies have analyzed the Hanwoo population managed by national institutions such as the Livestock Improvement Main Center and the National Institute of Animal Science. Differences occur in Hanwoo populations raised in different provinces of Korea. Therefore, this study collected basic information for improving Hanwoo in the Gyeonggi region by estimating the LD between SNP markers in autosomes and analyzing the Hanwoo raised in the Gyeonggi region using the Hanwoo SNP 50K BeadChip.
Materials & Methods
1. DNA sample
Tail hair samples collected from 827 Hanwoo raised in the Gyeonggi region were subjected to SNP Chip analysis. The hanwoo traceability data were collected through the Korea Animal Improvement Association. The study was approved by the Hankyong National University Animal Ethics Committee (No.2018-1).
2. Genotyping
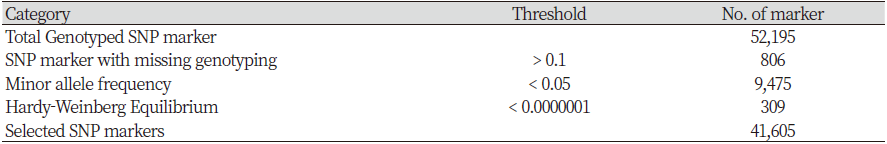
The Hanwoo 50K SNP Analysis BeadChip was used to analyze genotype using DNA extracted from the tail hair root. Final report file was output using GenomeStudio 2.0 software (Illumina Inc, 2016) in order to convert the obtained genotype information into a Plink version 1.9 (Purcell et al., 2007) analysis format, ped and map files were created after the PLINK formatting process using the Perl language. As a results, 52,195 SNPs were obtained through the analysis. The quality control (QC) performed using the Plink version1.9 (Purcell et al., 2007) removed unnecessary SNPs. SNPs with call rates < 0.90 (806), minor allele frequency (MAF) <0.05 (9,475), and those deviating from Hardy–Weinberg equilibrium (HWE) p-value <1 × 10⁻⁷ (309) were excluded from the analysis. The final dataset consisted of 41,605 SNPs (Table 1).
|
Table 2. Number of SNPs and genetic information of each autosome in Gyeonggi hanwoo 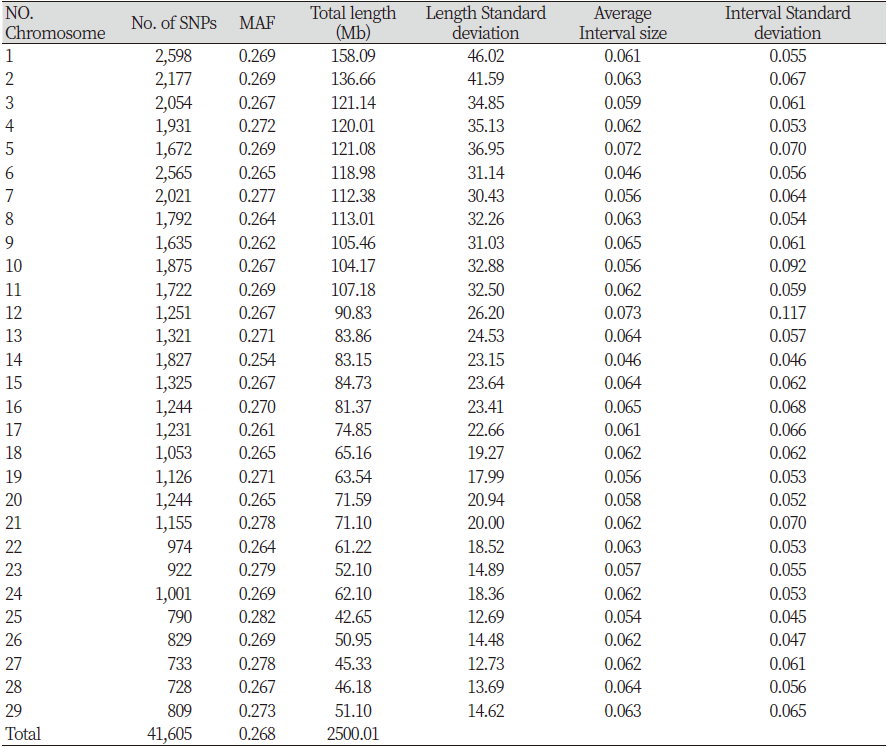
|
|
MAF: minor allele frequency |
3. Linkage Disequilibrium (LD) analysis
LD indicated that alleles at two loci were related, and were hereditary, and could be estimated using D' or r2, standardized for D (Lewontin et al., 1964; Hill et al., 1968). However, since LD estimation using the statistical value D’ may cause overestimation when the population size is small or the allele frequency is low, the r2 parameter, a statistic indicating the correlation of the alleles at two loci was estimated using the D’ (McRae et al., 2002, Hayes, 2007). To calculate the LD between two SNP markers, analysis was performed using the --r2 --ld-window-r2 0 --ld-window 99999 --ld-window-kb 1000 option of the Plink version 1.9 (Purcell et al., 2007). The LD (r2) of loci A and B on the same chromosome was calculated as follows:
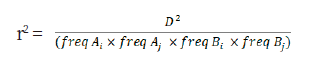
where freq Ai, freq Aji, freq Bi and freq Bji are the observed frequencies of alleles Ai, Aji, Bi, and Bji, respectively. Then D was calculated as follows:
D = freq AiBi × freq AjBj− freq AiBji × freq AjBi
where freq AiBi, freq AjBj, freq AiBji, and freq AjBi are the observed haplotype frequencies of alleles between the two markers. LD obtained through analysis was presented numerically and graphically using the R package (The R Project for Statistical Computing, ver.4.1.2; http://www.r-project.org).
Results and discussion
In this study, 52,195 SNPs were identified by analyzing the genotypes of 827 Hanwoo cattle raised in the Gyeonggi region. LD analysis was performed using 41,605 SNP markers, excluding 10,590 SNPs, selected by the QC process. The SNPs available per chromosome are presented in Table 2. The mean MAF of 29 autosomes was 0.268. The total genome length was 2,500.01 Mb, with chromosome 25 (42.65 Mb) being the shortest and chromosome 1 (158.09 Mb) being the longest. The distance between each analyzed SNP ranged from 0.046 to 0.073 Mb, and the longest was 0.073 Mb on chromosome 12. The confirmed standard deviation showed that the distance between the SNPs was not uniform. Cho et al. (2012) reported an SNP distance range of 0.055 to 0.074 Mb and showed similar overall results.
SNPs were classified according to the MAF to confirm the distribution, and 51,080 SNPs were used, including SNPs with an allele frequency of ≤ 0.05 (Fig. 1). As a result, except for SNPs with an allele frequency of 0.05 or less, a uniform distribution across the common frequency classes was observed due to the design of the SNP chip, optimized for a uniform SNP spacing and allele frequency distribution.
In general, LD is estimated larger r2 value by a smaller effective population size, a higher inbreeding within an analysis population, when the gene frequencies of the population are distinctly different. The degree and extent of LD in livestock breeding includes important information for marker-assisted selection and fine mapping of QTLs (Hayes et al., 2003; Du et al., 2007). Thus, it is the most appropriate method to identify SNPs or haplotypes that are significantly related to phenotypic trait variation.
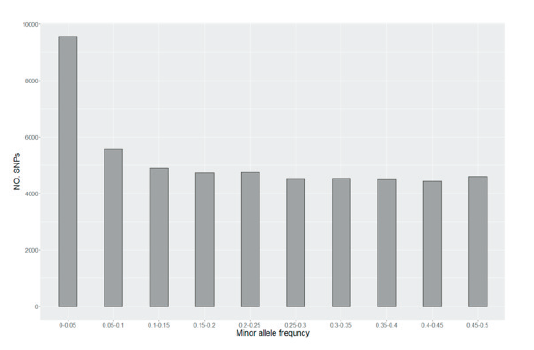
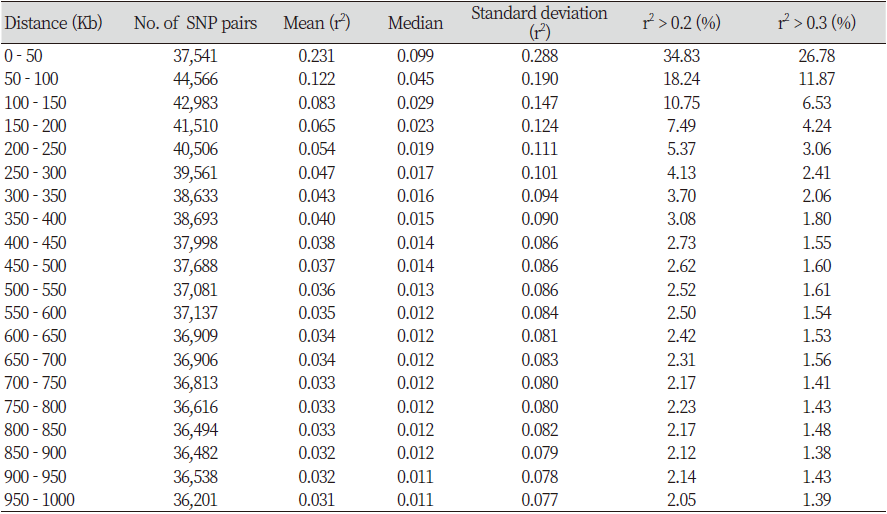
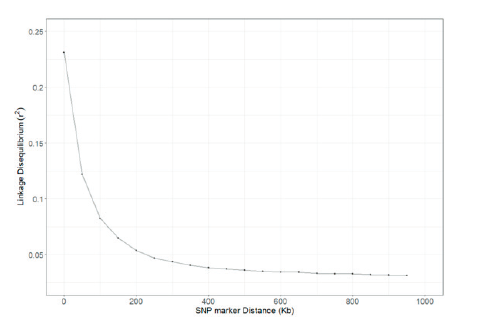
Table 2 shows the distances of pair-wise LD that were binned into 50 Kb intervals. The average r2 and the number of SNP pairs were calculated for each interval. A total of 766,856 SNPs pairs were evenly distributed, and the closer the distance between the SNPs, the higher was the r2 value. The number of SNP pairs was the lowest at 36,201 pairs when the SNP distance was between 950 and 1,000 Kb, and the highest at 44,566 pairs for distance between 50 and 100 Kb. The r2 value was 0.231 for SNP distance between 0 and 50 Kb and was 0.065 for SNP distance between 150 and 200 Kb, and Fig. 2 shows the decay of LD. A similar study performed by Cho et al. (2012) and Li and Kim (2015) found that the LD decayed at less than 200 Kb, and the r2 value decreased after 200 kb. In addition, r2 > 0.2 of adjacent SNPs were 34.83% and 18.24% for a distance of 0-50 Kb and 50-100 Kb, respectively. Marques et al. (2008) extended the range of r2 > 0.2 in Holstein chromosome 14 to 100 Kb, and Sargolzaei et al. (2008) reported that the r2 value of Holsteins in Canada and North America was 0.59 for a distance of 0-100 Kb. McKay et al. (2007) reported r2 values of 0.55, 0.05, 0.41, 0.47, 0.61, 0.58, 0.53, and 0.28 for a distance of 0-100 Kb in Angus, Charolais, Brahman, Dutch black and white dairy cattle, Holstein, Japanese black, Limousin, and Nelore breeds, respectively. The r2 value of the other breeds was higher than the r2 value of Hanwoo estimated in this study. Meuwissen et al. (2001) reported that the LD r2 value should exceed 0.2 for the genomic estimated breeding value (GEBV) accuracy to reach 85%, and Ardlie et al. (2002) pointed that for the r2 value to provide sufficient power for GWAS it should be greater than 0.3. In the case of breeds such as Angus and Holstein, genetic improvement has been carried out for approximately 100 years, whereas the improvement of Hanwoo has been carried out for a relatively short period, approximately 40 years (Jo et al., 2012). In addition, the selection intensity for Hanwoo genetic improvement is relatively low than of other varieties.
Genetic improvement is a technology that selects desirable livestock economic traits and enhances them to suit human needs. Performance tests or progeny tests evaluated based on phenotype and pedigree were used in the past. However, they were time-consuming and could not predict the results accurately; hence, genetic improvement using genomic information is now utilized (Kim, 2021). Genetic marker development has made it possible to improve livestock genetic ability and will become a major factor in deciphering various traits and diseases. Recently, a large-scale SNP panel (50K, 700K, HD, etc.) was commercialized, many studies have used SNP markers in Hanwoo (Lee et al., 2011, Cho et al., 2012, Li and Kim, 2015). In addition, a Hanwoo SNP chip with a Hanwoo specific marker was developed and commercialized, and the second version had been recently developed. Hanwoo improvement has been conducting genetic ability evaluations since the 1980s to select genetically superior KPN. The frozen semen of the selected KPN is used in the artificial insemination of cattle raised across the country (Park et al., 2011; Shin et al., 2018). Genetic improvement through limited KPN shows a reduction in the genetic diversity, effective population of Hanwoo, and improvement plateau, and an increase in the inbreeding coefficient within the population (Woolliams, 2004; Weigel, 2001). A significant reduction in genetic diversity due to inbreeding or effective population reductions can lead to inbreeding depression and species extinction (Zenger et al., 2007). This study confirmed that Hanwoo in the Gyeonggi region showed no difference in LD. It is thought that the genetic diversity was retained due to the influx of various Hanwoo species nationwide. However, it is necessary to test cow to prevent the occurrence of inbreeding and a reduction in genetic diversity caused by a preference for a specific KPN. This study can be a source of basic data for the genetic improvement of Hanwoo cattle in the Gyeonggi region.