Introduction
The description of Nigerian local chickens (NLCs) is based on phenotypic traits (Nwosu et al., 1985; Adebambo et al., 1999). Such information if complemented with findings obtained using molecular markers could be useful in formulating long term inference or plans for genetic improvement programs (Adebambo et al., 2010). There are different Ecotypes of Nigerian chickens with varying shapes, sizes and plumage colours which can be grouped into two major categories; i.e. ‘light’ Ecotype (YE) and ‘heavy’ Ecotype (FE) distributed across the different agro-ecological zones in Nigeria (Oluyemi et al., 1982). These Ecotypes have become eco-adapted to the Nigeria environment; as such they thrive better and are less susceptible to disease when compared to exotic breeds (Obioha et al., 1983). However exotic breeds perform better economically especially when considering meat and egg production (Ajayi, 2010). The exotic broiler (EB) chicken (fast growing chickens) is characterized by higher growth rate, higher overall body size and weight in contrast with NLCs (slow growing chickens) with slower growth rate and lower production performance (Nwosu et al., 1980); which is consequential to their prolonged generation interval and slow genetic progress (Adebambo, 2003). Nevertheless, the NLCs which constitutes 80% of poultry raised in rural areas of Nigeria (RIM, 1992) are most favoured by indigenes who believe their meat and eggs are more palatable and that they have better fertility and egg hatchability (Obanu et al., 1984).
Molecular markers could be used to speed up improvement of the productivity of The NLC through introgression and genomic selection approaches, however, there is currently little known about the genetic composition of NLCs, particularly as it pertains to the genes responsible for production performance and their regulators. Indeed, there is a pressing need for research to fill this information gap to enable use of molecular approaches in Improvement of the NLC. One strategy for gaining information of molecular markers underlying determination of production traits in a bred of interest involves examination of genes which have been shown to function in regulation and/or determination of a trait of interest, albeit through evidence gathered from a different breed of species. This approach is known as a Candidate gene approach. Where an examination of such candidate genes in the species of interest (through sequencing and genotyping) reveals an association between production performance and specific alleles, such a gene is said to be “informative” and the alleles associated with high performance can be selectively introgressed and/or enriched in the breed of interest (through Marker Assisted Selection/Genomic Selection) to raise overall breed performance, Candidate genes and other molecular markers linked with Quantitative Trait Loci have been shown to possess significant effects on many traits of interest (Mukhopadhyay and Kumar, 2013) and are increasingly being applied to animal improvement.
While a large number of genes have been implicated in the functional biology of growth and could therefore serve as candidate genes for determination of the contrast in growth performance between the Nigerian Chickens and EB chickens, the present study was designed to characterise representatives of a small subset, namely the somatotropic axis (SA) genes. The SA genes, which include growth hormone (GH), insulin-like growth factors (IGF –I and II), their associated carrier proteins, receptors and hormones such as insulin, leptin and thyroid hormone have previously been implicated in the functional biology of growth determination (Nie et al., 2005; Kadlec et al., 2011). Studies have revealed that SNPs of SA genes affect growth traits considerably (Nie et al., 2005; Lei et al., 2005; Qui et al., 2006). IGF-I or IGF1 also known as somatomedin C (Höppener et al., 1985) has been discovered to regulate body and muscle growth, stimulate glucose uptake, inhibits protein degradation (Duclos, 1998) and improve growth of multiple tissues like bones and cartilage (Bianda et al., 1999). Also, embryonic chick skeletal muscle undergoes profound hypertrophy in response to ectopic IGF-I resulting in two to three folds increase in total muscle mass (Winner et al., 2006). cGH is considered an important gene that influences performance traits because of it crucial functions in growth and metabolism (Vasilatos-Younken et al., 2000). It also mediates physiological functions such as reproduction (Enayati and Rahimi-Mianji, 2009).
Specifically, this study was designed examine two SA genes, namely insulin-like growth factor I (IGF –I) and Chicken Growth Hormone gene (cGH),.to identify and describe nucleotide sequence polymorphisms within the conserved regions IGF-I and cGH sequences of HB, FE and YE chickens; as a first step towards examining the effect of such polymorphisms on growth and performance.
MATERIALS AND METHOD
Primer Design
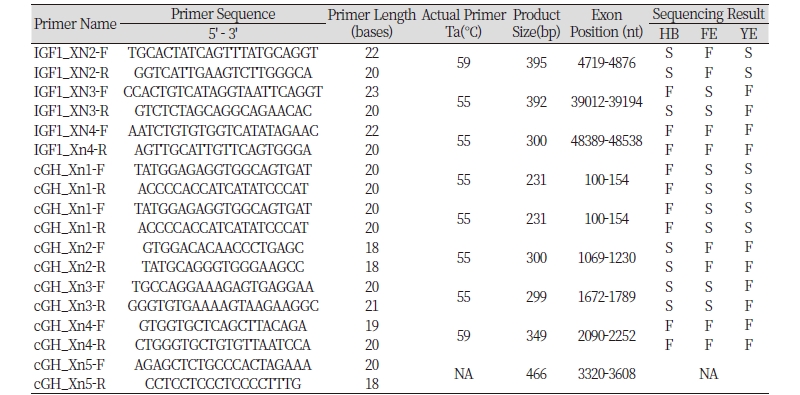
The Chicken IGF1 (ENSGALT00000000328) and cGH (ENSGALT00000020816) gene sequences were retrieved from ENSEMBL and GENBANK databases. Then forward and reverse primers were designed to amplify each exon of each gene, with primers anchored within the 5’ and 3’ flanking DNA of each exon by use of Primer3web Version 4.0.0.
Blood Collection and DNA Extraction
1ml of blood was collected via the brachial vein of each bird using sterilized disposable 2ml syringe and needle into EDTA (Ethylene-di-amine-tetra-acetic acid) bottles to prevent coagulation. DNA was then extracted from blood samples using the procedure described by Wang et al. (2006). DNA yield and purity were accessed by the use of Nano-drop spectrophotometry analysis.
Amplification of Exons
Each pair of primer was used to amplify it corresponding Exon by PCR (Polymerase Chain Reaction) using genomic DNA from each of the three breeds as template in separate tubes. For each reaction, a PCR cocktail was prepared containing 12.5μl of 2X Master mix with standard buffer (constituting 20Mm of Tris-HCl, 1.8Mm of MgCl2, 22Mm of NH2Cl, 22Mm of KCl, 0.2Mm of dNTPs, 5% glycerol, 0.06% IGEPAL, 0.05% of Tween, Xylene Cyanol FF, Tartrazine and 25units/ml of one Taq DNA polymerase), 4μl of 25ng/μl chicken DNA template, 2.5μl of a 25pM stock of forward and reverse primers, and distilled deionized H2O to a final volume of 25μl. The thermal profile was as follows; 2 minutes at 95°C followed by 35 cycles of denaturation (30’’ at 95°C), annealing (1’ at 55°C, 58°C or 62°C) and extension (30’’ at 72°C) and final incubation at 72°C for 5 minutes. The PCR amplicons were resolved by gel electrophoresis on a 1% agarose gel containing 5μl of ethidium bromide at 100volts for 45 minutes; which revealed a single clear band when viewed under UV trans-illuminator.
Sequencing
The PCR products were purified and sequenced through a commercial service (Inqaba Biotec Company, South Africa; using LIZ500 (ThermoScientific), ABI 3500XL Genetic Analyzer for Applied Biosystems, POP7™). Sequences results (electrophoretogram) supplied by Inqaba were viewed using Finch TV v1.4.0.
Multiple Sequence Alignment
The sequence of each successfully sequenced Exon from each of the examined breeds was aligned (MultAlin; Corpet, 1996) against the known sequence of the corresponding chicken gene (IGF1; ENSGALT00000000328) and (cGH; ENSGALT00000020816) to confirm that the intended fragment of the target gene has been correctly amplified and sequenced.
Phylogenetic Analysis
Phylogenetic analysis was carried out using MultAlin (Corpet, 1996) and phylogenyfr (Dereeper et al., 2008) to determine the evolutionary relationship amongst orthologs.
Search for Regulatory Sequences (MOTIFS)
Tfsitescan (http://www.ifti.org/cgi-bin/ifti/Tfsitescan.pl) online Motif searching software was used to scan for known gene regulatory sequences within the polymorphic intronic flanks of Exons DNA (i.e. in IGF1 Exon 2 and cGH Exon 3 flanking DNA.
RESULTS
All four Exons of IGF1 gene were successfully amplified across all three breeds (Table 1). However, only 33% produced readable sequence, specifically; HB Exon 2, YE Exon 2 and FE Exon 3 forward and reverse primer sequencing, and HB Exon 3 reverse primer sequencing (Table 1). Furthermore, all but Exon 5 of cGH gene were successfully amplified across the three breeds. However, only 42% produced readable sequence, namely; forward and reverses primers sequencing of FE Exon 1 and 3, YE Exon 1 and HB Exon 2 and 3 (Table 1). Although attempts were made to sequence other PCR products of IGF1 and cGH for HB, FE and YE chickens, none of the sequencing reactions was successful (Table 1).
Nucleotide Sequence Polymorphism in IGF1
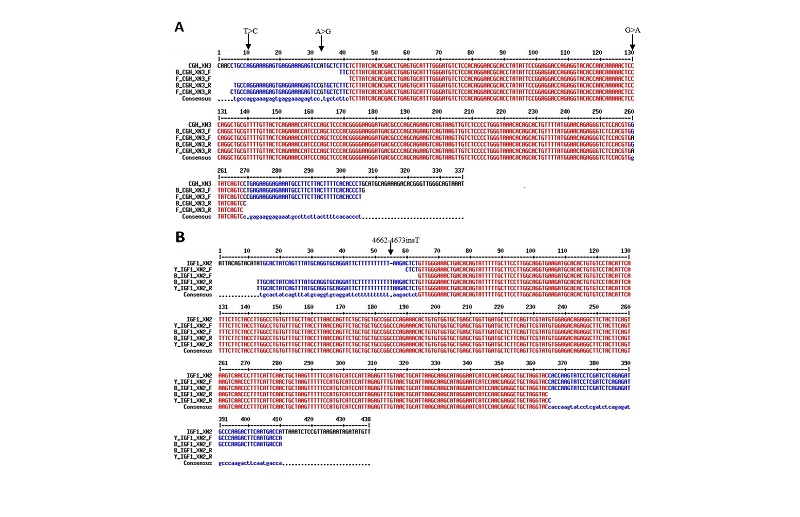
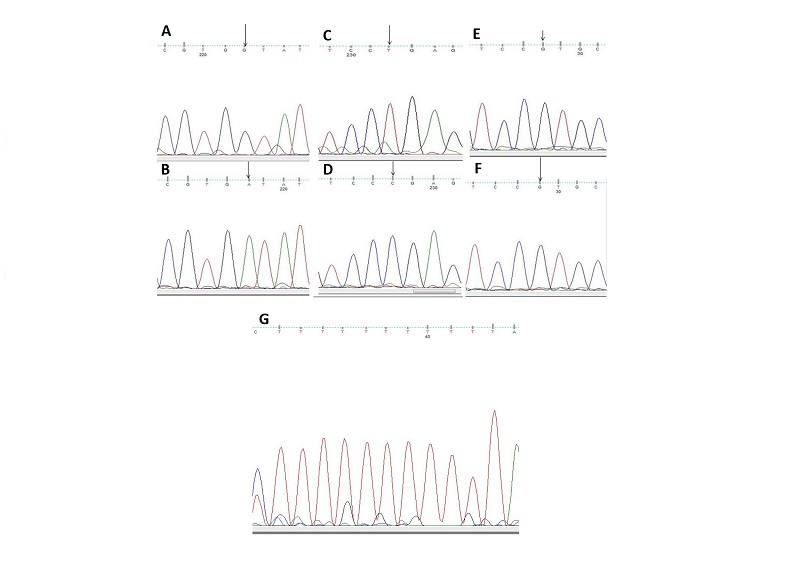
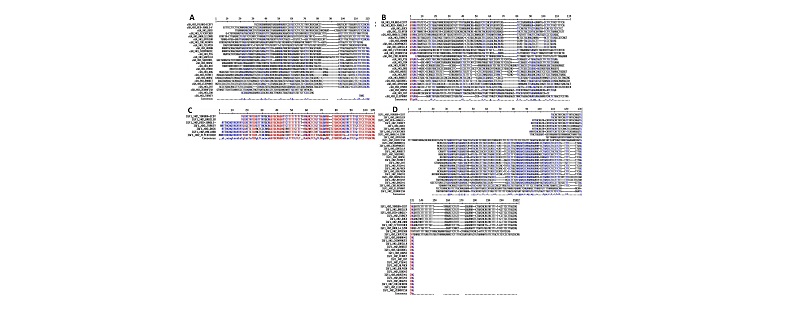
Multiple sequence alignment of IGF1 Exon 2 from HB and YE (including flanking intron DNA) against the corresponding region of RJF (ENSGALT00000020816) IGF1 revealed no sequence polymorphism (deletion, insertion, inversion or substitution) in the coding portion. However, a pyrimidine (thymine, T) insertion was observed within a poly-T stretch in intronic sequence at the 5’ flanking DNA from HB and YE relative to RJF (Figures 1&2). The insertion location corresponds to bases 4662-4673insT of RJF primary transcript (numbering from nt -100 in the 5’ UTR preceding Exon 1) at the Intron DNA between Exons 1 and 2.
Nucleotide Sequence Polymorphism in cGH
Multiple Sequence Alignment of cGH Exon 3 from FE and HB (including flanking intron DNA) against the corresponding region of RJF (ENSGALT00000000328) cGH revealed no sequence polymorphism in the coding portion. However a purine (Adenine A) to purine (Guanine G), Inversion Single Nucleotide Polymorphism (SNP) located at base 1644 of the RJF primary transcript (numbering from nt -100 in the 5’ UTR preceding Exon 1) was observed. Thispolymorphism falls in the 5’non-coding portion of the amplified exon 3 fragment; the RJF carried the 1644 Adenine (A) allele and the FE and HB carried the 1644 Guanine (G) allele i.e. 1644A>G (Figure 1&2). A second purine to purine polymorphism (1850G>A) was observed in the 3’non-coding portion. The RJF and HB carried the Guanine (G) allele and FE carried an Adenine (A) allele (Figure 1&2). A third pyrimidine to pyrimidine polymorphism (1860T>C) SNP was observed in the non-coding portion (3’). The RJF and HB carried the thymine (T) allele and FE carried a Cytosine (C) allele (Figure 1&2)
Phylogenetic Analysis
IGF1Gene
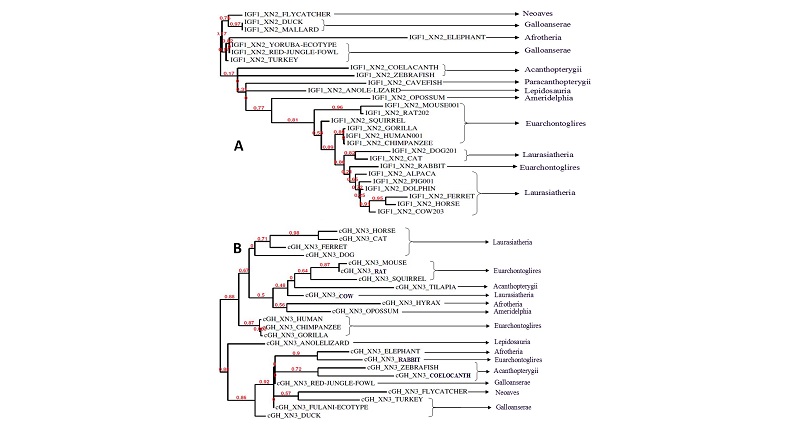
Multiple Sequence Alignment of IGF1 Exon 2 and flanking DNA Sequence (5’ and 3’) from YE against the RJF and several Avian orthologs showed a region of conservation at the Intron – Exon boundary (e.g. the conserved stretch of 11bases TTCCTTGGCAG at the splice acceptor region 3’ end of the intron 1, including the canonical splice acceptor dinucleotide AG at the 3’ terminal pair of bases) and also within (e.g. the GGTGCAGGA sequence located from position 4232 to 4240 of Intron 1 in RJF (Figure 4). However the regions did not remain conserved when non Aves were included in the alignment; although the canonical splice acceptor AG also remained conserved (Figure 3).
cGH Gene
The phylogenetic analysis of cGH Exon 3 and flanking Intron DNA (100bp before and after the Exon) for FE against RJF and gene orthologs (spanning Aves, Eutherian and non-eutherian mammals, pisces and other vertebrates) showed limited conservation (Figure 3&4); with some regions suggesting insertions and deletions (Figure 3&4). However the terminal pair of bases (AG and GT) of the canonical splice acceptor and donor (3’and 5’end of the intron respectively) were conserved (Figure 3&4).
Regulatory Sequences (Motifs)
A scan for known gene regulatory sequences in the IGF1 Exon 2 and cGH Exon 3 sequences plus flanking DNA identified three sequence signatures. These are:
Motifs in cGH
GATA binding sites in Cis-regulatory elements overlapping the site of polymorphism (1850G>A and 1860T<C) in the FE but not RJF and HB
Immunoglobulin repressor motif (TCCCGAGAAGGA) in FE and HB (but not RJF) overlapping the polymorphic base (1644A>G).
Motifs in IGF1
Liver-specific DNA-binding protein sequence signature (TTTTTAAG) overlapping the single base insertion (4662-4673insT) region in HB and YE, also found in RJF (ENSGALT00000020816).
DISCUSSION
The pattern of polymorphism of the cGH Exon 3 substitutions 1644A>G, 1850G>A, and 1860T>C SNPs across RJF, HB and FE breeds revealed three distinct haplotypes (of the eight theoretically possible from the patter of allelic polymorphism observed at each of the three loci), each unique to one of the three examined breeds. Specifically, while RJF carried the haplotype 1644A-1850G-1860T, the HB carried Haplotype 1644G-1850G-1860T and FE carried haplotype 1644G-1850A-1860C. Through the use of these cGH SNP haplotypes, the three groups can be distinguished at the molecular level. The resultant haplotypes will be useful for studying the effect of cGH on performance. Thus, this study validates the utility of comparative sequencing of candidate genes for identifying breed specific haplotypes as a prelude to gene association studies.
The resultant phylogram of IGF1 Exon 2 (Intron 1) flanking Intron DNA for YE against RJF and corresponding sequences for gene orthologs across a broad range of phylogenetic clades spanning Aves, Eutherian and non-eutherian mammals, pisces and other vertebrates was not consistent with published phylogenetic trees (Hoshiyama et al., 2007; Shalchian-Tabrizi et al., 2008; Zhou et al., 2010) reflecting the most probable natural history and evolutionary relationship of examined groups. The inconsistency of the resultant phylogram may have occurred due to convergent, evolution, Para-evolution, evolutionary reversals or homoplasy (Convergence Parallel Evolution) which may have resulted in construction of an incorrect tree with respect to the overall evolutionary history. Similarly resulting phylogram of inputted sequences of cGH Exon 3 (Intron 3 and 4) (100 bases from the target Exon) was also not consistent with published phylograms. The resulting phylogeny trees revealed by the maximum likelihood system of phylogenyfr online tool (Dereeper et al., 2008) is shown in Figure 3.
The first site in which regulatory signature was found corresponds to FE inversion SNP 1850G>A. This signature is called a GATA-motif; it is 6bp long (GTGATA). The search revealed that the SNP 1850G>A has created regulatory signature in FE, which was absent from HB and RJF; thus making the SNP location a potential transcriptional binding site in FE. Although the GATA motif hasn’t been reported in cGH gene, GATA-sequence conforming to the consensus [T/A (GATA) A/G] was reported to be present in all chicken globin gene promoters (Evans et al., 1991). These Short DNA sequences within control elements of genes constitute cis-regulatory motifs recognized by nuclear proteins that participate in transcription (Mitchell and Tjian, 1989). Through studies largely focused on genes expressed in hematopoietic cells, the motif GATA has become recognized as a Cis-regulatory element in diverse genes (Orkin, 1992). Thus they may also confer similar functions in the cGH gene given that it was found in the cGH gene in the present study. Genes in which GATA-Binding Sites have also been found in Cis-Regulatory Elements includes: Erythroid-expressed genes and globinregulatory sequences, Megakaryocytic-expressed genes, Mast cell-expressed genes, and Endothelial cell-expressed genes (Orkin, 1992).
The uncovering of another regulatory site (Immunoglobulin Repressor Motif) overlapping the polymorphic (1644A>G) site in FE and HB Intron DNA sequence flanking cGH Exon 3 that was not detected in the same region for the alternative allele (RJF); thus creating an hypothesis that the inversion in cGH Intron 2 amplified along with Exon 3 of the FE and HB created this regulatory motif. Similar sequence signature have been reported to be present in Nuclear matrix attachment regions (MARs) flanking immunoglobulin heavy chain intronic enhancer (Eμ) which are the targets of the negative regulator, NF-μNR, found in non-B and early pre-B cells (Wang et al., 1999); they propose that Cux/CDP regulates cell-type-restricted, differentiation stage-specific μm enhancer activity by interfering with the function of nuclear matrix-bound transcription activators. Since the sequence overlaps the SNP site in the flanking Intron DNA sequence (Intron 3) of the Exon 3 of the cGH gene in FE and HB; it could thus be suggested that the site might serve has a repression enhancer factor in the gene too.
The sequence signature which was found overlapping the single base insertion (4662-4673insT) region in IGF1 Exon 2 flanking intron DNA of HB and YE has previously been recognized as the double-stranded oligodeoxynucleotides that represent protein binding sites in the regulatory regions of the mouse genes encoding transthyretin (TTR) and α1-antitrypsin (αl-AT) bound a nuclear protein factor(s) found mainly in hepatocytes. This sequence signature was also present in the Red Jungle Fowl (ENSGALT00000020816) 5’ flanking Intron DNA sequence, suggesting the insertion in IGF1 Intron 1 amplified along with Exon 2 of the HB and YE did not create this regulatory motif. A site in the regulatory region of the gene encoding rat serum albumin and, surprisingly, a region in the simian virus 40 enhancer also bind the same factor (Costa et al., 1988). All these binding sites, which contain only minimal sequence similarity, may bind to a single protein, or a similar family of proteins, that activates liver-specific transcription of co-ordinately expressed genes (Costa et al., 1988). A nucleotide insertion site of HB and YE (IGF1 Exon 2 flanking Intron i.e. Intron 1) similar to RJF was identified by Tfsitescan as a site that might share homology with the reports of Costa et al. (1988).
The exact bases for constrained evolution of bases at these locations and their consequences with respect to gene functions are not known in this present study. However it seem plausible that they are involved in the formation of secondary and or tertiary gene structure, DNA to DNA and or DNA to protein interaction involved in the regulation of gene transcription and therefore gene function
CONCLUSION
The lack of polymorphisms in aligned sequences of cGH Exon 1 for FE and YE, cGH Exon 3 for HB and FE; and IGF1 Exon 2 for HB and YE and IGF1 Exon 3 for HB and FE suggests these particular Exons are not responsible for the differences in growth rate observed between the breeds. The intronic polymorphisms revealed could however serve as molecular markers for the breeds carrying the variants that are distinct from at least one other breed; thus creating a molecular identity for such a breed.
Transcriptional binding sites revealed in this study may serve similar functions as reported in other genes (Costa et al., 1988; Orkin, 1992; Wang et al., 1999). These regulatory sequences may affect the final genes transcription and eventual expression of the gene products (cGH and IGF1), thus affecting the genes functionalities in the observed breeds. Until proven by further research, this may or may not relate to their growth performances.
These data also points to the utility of multi-modal studies combining comparative genome sequencing with bioinformatics for identifying molecular markers in highly informative portions of candidate genes in a prelude to examination of their utility as trait surrogates in Association Studies and eventual use in Marker Assisted improvement of NLCs.