Introduction
Korea is conducting improvement on each breeding farm which caused reduction in efficiency of selection due to small unit of examination and selection. Also, it disables efficient use of prime breeding swine and has low effect of causing competition because there is no genetic connection between breeding farms and one cannot evaluate genetic ability between farms.
Thus, the government has carried out Swine Genetic Improvement Network Program to develop pig industry by carrying forward efficient pig improvement by selecting breeding swine that fit Korean environment via selection, exchange and repetitive evaluation of prime breeding swine, which is done by heightening the effect of improvement through genetic connection between breeding farms and establishment of country-wise genetic ability evaluation system using genetic connection(network) that is caused by exchange of prime breeding swine among breeding farms. Paternal line examined genetic connectedness among farms in 2012 by sharing 10% of crossbreeding maternal swine through nucleus AI center with selected breeding swine regarding phenotype at the beginning of the business and estimated genetic parameter and developed selection formula. Genetic evaluation has been conducted biweekly since July, 2015. Thus, Paternal line(Duroc) genetic ability evaluation enabled continuous selection and cross breeding of each breeding pig using selection index and breeding value of each character.
Therefore, this study establishes the difference between participating breeding farms and non participating breeding farms that are participating in Swine Genetic Improvement Network Program. Also, this study was done to be used as a base line data for production of Korean breeding swine by establishing nation-wise genetic ability evaluation system using the difference between the farms which was just mentioned.
Materials and methods
1. Materials
The data that was used for this study is from 128,433 Swine Genetic Improvement Network Program participating breeding farms and 106,410 non participating breeding farms from 248,422 farms that were farm certified by KAIA(Korea Animal Improvement Association), excluding outliers. For the analysis,5 characters, such as ADG(g), 90KG(day), BF(mm), LMA(㎠) and LP(%) were used.
The data that was used for this study is from 128,433 Swine Genetic Improvement Network Program participating breeding farms and 106,410 non participating breeding farms from 248,422 farms that were farm certified by KAIA, Korea Animal Improvement Association, excluding outliers. For the analysis, 5 characters, such as ADG(g), 90KG(day), BF(mm), LMA(㎠) and LP(%) were used.
For genetic parameter estimation, among evaluated individuals, 235,596 individuals that had information of their parents were used for analysis and using registered number, traced later generation and used pedigree information of 273,218 swine for analysis.
2. Statistic analysis methods
Genetic parameter estimation that is done in this study considered race, calving number, sex, year and month of end of examination of farm and classification of examination as environmental factor that affects examination character for analytic model and the end of examination date was analyzed with covariation.
Analytic model for genetic parameter estimation of additive gene effect of each character is as follows and used Multiple Traits Animal Model which considers 5 characters as dependent variables, ADG, A90KG, BF, LMA and LP at the same time for analysis.
The model above can be expressed as matrix equation as follows.
Y=Xb+Zu+e
At this point,
Y : Vector of observed value for each character
X : Coefficient matrix of fixed effect (Sex, calving number, year of examination, examination classification, date of examination)
Z : Coefficient matrix of random effect on individual
b : Vector of estimated value on unknown fixed effect.
u : Vector of breeding value of individual ~N(0,G)
e : Vector of random error of each character ~(0,R)
Expected value, variance and covariance are as follows.
E(Y) = Xb
Var (u ) = G = G *⊗A
Var (e ) = R = R *⊗I
Var (y ) = V = ZGZ′ + R
At this point,
A : Additive coefficient of kinship matrix
G * : Additive gene variance-covariance matrix
R * : Random error variance-covariance matrix
I : Unit matrix
⊗ : Kronecher product (Searle, 1982)
Also, for realignment of renumbering, fixed effect and random effect of pedigree data, RENUMF90(Misztal, 2012) was used and for genetic parameter estimation, based on REML algorithm, REMLF90(Misztal, 2002) which was invented based on Fortran was used to repeatedly estimate to make residual variance converge to less than 10-11 and got Variance-covariance value.
Using the characteristics of variance and covariance and characteristics of error variance and covariance that was found in the model above, heritability, genetic correlation, and phenotypic correlation coefficient were calculated using following equation.
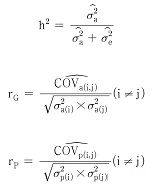
At this point, σa2 is additive genetic variance, rG is genetic correlation, rP is phenotype correlation.
Accuracy of additive genetic effect on individual was calculated from standard error as follows.
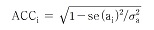
Here, se(ai)2 is estimated error variance of ith individual, and σa 2 is additive gene variance.
Results and Discussions
1. genetic parameter estimation
Estimated accuracy, heritability and genetic correlation of examination character that this study estimated are listed in Table 1. Estimated heritability of ADG, 90KG, BF, LMA and LP are 0.43, 0.45, 0.53, 0.25 and 0.43 and genetic variance are 1267, 39.21, 1.98, 2.15, and 2.55, and residual variance are 1651, 48.55, 2.59, 6.60, 3.40 and accuracy are 0.77, 0.77, 0.78, 0.69, and 0.78 respectively.

2. genetic correlation.
Regarding the genetic correlation between economic trait, listed in Table 2, coefficients of genetic correlation between 90KG, BF, LMA and LP on ADG are estimated to be -0.99, -0.11, -0.38 and -0.04. This tells individuals with big ADG has less 90KG but LMA relatively decreases. Coefficients of genetic correlation between BF, LMA and LP on 90KG are estimated to be 0.11, 0.37 and 00.4 and the coefficients of genetic correlation between LMA and LP on BF are estimated to be -0.21 and -0.86 and the coefficient of genetic correlation of LMA and LP is estimated to be 0.43. It is estimated that LMA and LP show highly positive correlation with 0.43 and estimated coefficient of genetic correlation of ADG and 90KG and that of BF and LP show highly negative correlation with -0.99 and -0.86 respectively. In terms of phenotype correlation coefficient, the coefficient of ADG and 90KG and that of BF and LP are estimated to show highly negative correlation with -0.98 and -0.38.
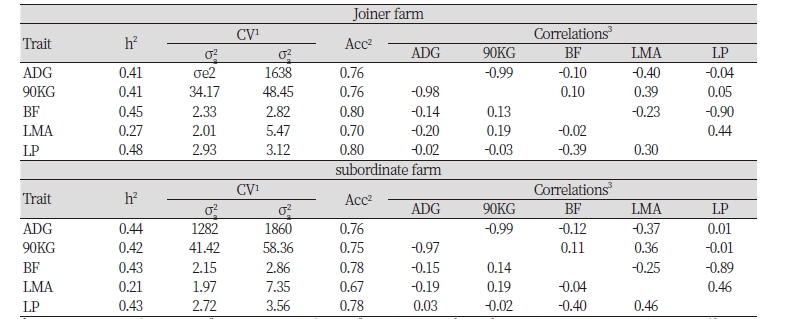
3. Heritability, accuracy, and correlation by breed of joiner farm in swine genetic improvement network program
Because there is little connectivity between pedigree of breeding swine, to confirm the difference in race, heritability and breeding value accuracy of examination characters were listed in Table 3, estimated using data of 37,991, 162,322, 35,283 of Landrace, Yorkshire and Duroc was used. First of all, heritability of Landrace that’s in Swine Genetic Improvement Network Program in ADG, 90KG, BF, LMA and LP are estimated to be 0.43, 0.42, 0.51, 0.20, 0.49, genetic variances are estimated to be 1185, 36.76, 2.49, 1.57, 2.75, residual variances are estimated to be 1558, 50.10, 2.43, 6.31, 2.84 and accuracy is estimated to be 0.74, 0.74, 0.78, 0.70, 0.79. Lastly, heritability of Duroc in ADG, 90KG, BF, LMA and LP are estimated to be 0.42, 0.43, 0.36, 0.22, 0.39, genetic variances are estimated to be 1352, 33.18, 1.29, 1.66, 1.98, residual variances are estimated to be 1855, 44.01, 2.34, 5.92, 3.15 and accuracy is estimated to be 0.75, 0.75, 0.75, 0.64 0.74.
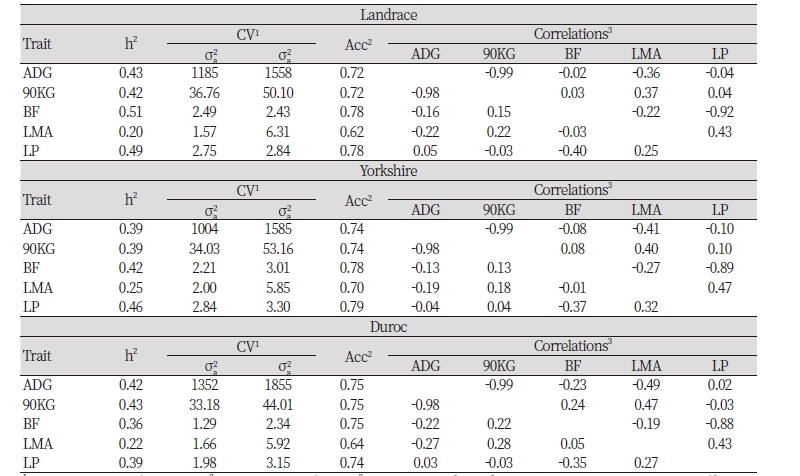
Looking at the genetic correlation and phenotype correlation between economic traits of breeds, first, regarding Landrace, genetic correlation coefficients between 90KG, BF, LMA and LP on ADG are estimated to be -0.99, -0.02, -0.36, and -0.04 and those of between BF, LMA and LP on 90KG are estimated to be 0.03, 0.37 and 0.04, those of between LMA and LP on BF are estimated to be -0.22 and -0.92, and that of between LP on LMA is estimated to be 0.43. Genetic correlation coefficient between LMA and LP shows highly positive correlation with 0.43, ADG and 90KG shows highly negative correlation with -0.99 and BF and LP shows highly negative correlation with -0.92. Also, phenotype correlation coefficient of ADG and 90KG shows highly negative correlation with -0.98 and BF and LP shows highly negative correlation as well with -0.40.
In terms of Yorkshire, genetic correlation coefficients between 90KG, BF, LMA and LP on ADG are estimated to be -0.99, -0.08, -0.41 and -0.10 and those of between BF, LMA and LP on 90KG are estimated to be 0.08. 0.40 and 0.10, those of between LMA and LP on BF are estimated to be -0.27, -0.89 and that of between LP on LMA is estimated to be 0.47. Like Landrace, estimated genetic correlation coefficient between LMA and LP show highly positive correlation with 0.47 and uniformly estimated genetic correlation coefficient shows highly negative correlation with -0.89. Also, in terms of phenotype correlation coefficient, like Landrace, coefficient of ADG and 90KG and that of BF and LP show -0.98 and -0.37 which are highly negative correlation.
In terms of Duroc, genetic correlation coefficients between 90KG, BF, LMA and LP on ADG are estimated to be -0.99, -0.23, -0.49 and 0.02, those between BF, LMA and LP on 90KG are estimated to be 0.24, 0.47 and -0.03, those between LMA and LP on BF are estimated to be -0.19, -0.88 and the coefficient between LP on LMA is estimated to be 0.43. Similar to the previous two breeds, the genetic correlation coefficient between LP on LMA shows highly positive correlation with 0.43 and that of between 90Kg and LMA shows highly positive correlation with 0.44 which is much higher than that of two previous breeds. The genetic correlation coefficient between ADG and 90KG as well as BF and LP show highly negative correlation with -0.99 and -0.88 and that of between ADG and LMA shows relatively higher negative correlation than two previous breeds with -0.49. In terms of phenotype correlation, like Landrace, coefficients between 90KG and ADG as well as BF and LP show highly negative correlation with -0.98 and -0.35.
Summing up the genetic correlation between economic traits of three breeds, genetic correlation coefficients between LMA and LP show highly positive correlation with 0.43~0.47, ADG and 90KG as well as BF and LP show highly negative correlation with -0.99 and -0.88~-0.92.
4. Heritability, accuracy, and correlation by breed of subordinate farm in swine genetic improvement network program
Heritability of Landrace of farms that are not participating in Swine Genetic Improvement Network Program in ADG, 90KG, BF, LMA and LP are estimated to be 0.49, 0.51, 0.48, 0.23, 0.45 respectively, genetic variances are 1694, 52.95, 2.63, 2.06, 2.98 respectively, residual variances are estimated to be 1766, 50.09, 2.82, 7.09, 3.61 respectively, and accuracy is estimated to be 0.76, 0.77, 0.77, 0.64, 0.76 respectively. Heritability of Yorkshire in ADG, 90KG, BF, LMA and LP are estimated to be 0.43, 0.41, 0.43, 0.22, 0.43, genetic variances are estimated to be 1210, 38.57, 2.11, 1.99, 2.62, residual variances are estimated to be 1584, 55.11, 2.83, 7.16, 3.45 respectively and accuracy is estimated to be 0.75, 0.75, 0.77, 0.67, 0.77 respectively. Lastly, heritability of Duroc in ADG, 90KG, BF, LMA and LP are estimated to be 0.45, 0.48, 0.42, 0.19, 0.4, genetic variances are estimated to 1503, 45.78, 1.49, 1.68, 2.09, residual variances are estimated to be 1821, 50.18, 2.06, 7.33, 2.71 respectively and accuracy is estimated to 0.71, 0.72, 0.72, 0.59 0.73 respectively
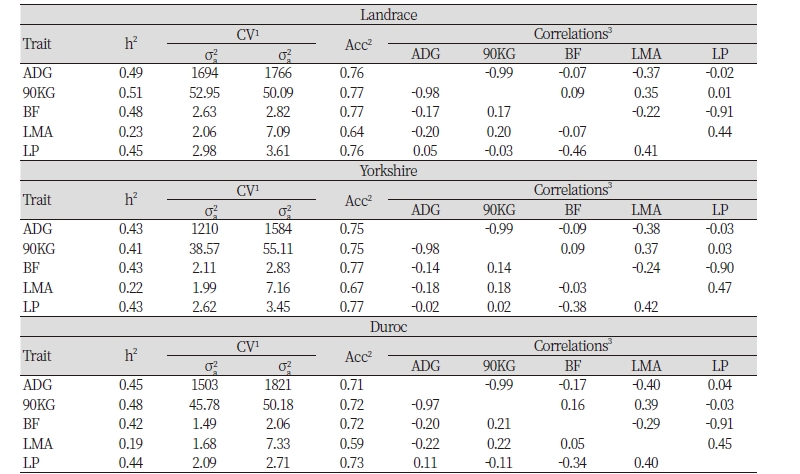
Looking at genetic correlation and phenotype correlation between economic traits of breeds, first, in terms of Landrace, genetic correlation coefficients between 90KG, BF, LMA and LP on ADG are estimated to be -0.99, -0.07, -0.37 and -0.02, those between BF, LMA and LP on 90KG are estimated to be 0.09, 0.35 and 0.01, those between LMA and LP on BF are estimated to be -0.22, -0.91 and the coefficient between LP on LMA is estimated to be 0.44. Estimated genetic correlation coefficient between LMA and LP show highly positive correlation with 0.44 and the coefficient between ADG and 90KG as well as BF and LP show highly negative correlation with -0.99 and -0.91. Also, in terms of phenotype correlation coefficient, coefficient of ADG and 90KG and that of BF and LP are estimated to be -0.98 and -0.46 which are highly negative correlation.
In terms of Yorkshire, genetic correlation coefficients between 90KG, BF, LMA and LP on ADG are estimated to -0.99, -0.09, -0.38 and -0.03, those between BF, LMA and LP on 90KG are estimated to be 0.09, 0.37 and 0.03, those between LMA and LP on BF are estimated to be -0.24, -0.90 and the coefficient between LP on LMA is estimated to be 0.47.Like Landrace, estimated genetic correlation coefficient between LMA and LP show highly positive correlation with 0.47 and the coefficient between ADG and 90KG as well as BF and LP show highly negative correlation with -0.99 and -0.89. Also, in terms of phenotype correlation coefficient, like Landrace, coefficient of ADG and 90KG and that of BF and LP are estimated to be -0.98 and -0.38 which are highly negative correlation.
In terms of Duroc, genetic correlation coefficients between 90KG, BF, LMA and LP on ADG are estimated to -0.99, -0.17, -0.40 and 0.04, those between BF, LMA and LP on 90KG are estimated to be 0.16, 0.39 and -0.03, those between LMA and LP on BF are estimated to be -0.29, -0.91and the coefficient between LP on LMA is estimated to be 0.45. Like the two previous breeds, estimated genetic correlation coefficient between LMA and LP show highly positive correlation with 0.45 and the estimated coefficient between 90KG and LMA show the highest positive correlation with 0.39 which is higher than that of the two previous breeds. The estimated genetic coefficients between ADG and 90KG as well as BF and LP show highly negative correlation with -0.97 and -0.99 and the estimated coefficient between ADG and LMA relatively more negative correlation with -0.40. Also, in terms of phenotype correlation coefficient, like Landrace, coefficient of ADG and 90KG and that of BF and LP are estimated to be -0.97 and -0.34 which are highly negative correlation.
Summing up the genetic correlation between economic traits of three breeds, the correlation between LMA and LP show highly positive correlation with 0.44~0.47 and that of between ADG and 90KG as well as BF and LP show extremely high negative correlation with -0.99 and -0.90~-0.91, highly negative correlation in genetic correlation between back fat thickness and fresh meat percent.
Summing up the phenotype correlation, phenotype correlation between LMA and LP show highly positive correlation with 0.40~0.42 and that of between ADG and 90KG show extremely high negative correlation with -0.97~-0.98 and that of between BF and LP show highly negative correlation with -0.34~- 0.46.
Using the data of 235,596 swine from farm certified by KAIA from 2010 to 2015 and using farm certification record of 128, 433 swine from breeding farms that participate in Swine Genetic Improvement Network Program and 106,410 swine from non participating farms, applied breed, calving number, sex and examination classification and etc. to the model which are confirmed to be environmental factors that affect examination characters. Also, setting examination classification of year of end of examination as contemporary group, estimated genetic parameters and accuracy of breeding value using the polymorphic individual model and to confirm difference of parameters between breeds, estimation of parameters of each breed was done additionally. Furthermore, using the estimated breeding value, study on changes in trend of genetic improvement between farms that participate in Swine Genetic Improvement Network Program and those that do not was done.
Looking at the estimated heritability, estimated heritability in ADG, 90KG, BF, LMA and LP are 0.43, 0.45, 0.53, 0.25 and 0.43 and genetic variances are estimated to be 1267, 39.21, 1.98, 2.15, 2.55 respectively, residual variances are estimated to be 1651, 48.55, 2.59, 6.60, 3.40 respectively and the accuracy is estimated to be 0.77, 0.77, 0.78, 0.69, 0.78 respectively.
The result of analysis on genetic correlation and phenotype correlation on economic traits shows estimated genetic correlation coefficient between ADG and 90KG is -0.99 which is the highest value which shows extremely high negative correlation and in terms of phenotype correlation, coefficient between ADG and 90KG shows highest correlation with -0.98. Also, regarding LMA, genetic correlation between LMA and ADG shows relatively high positive correlation with 0.38 and between LMA and 90KG shows positive correlation with 0.37. LP shows low correlation with ADG and 90KG, but with BF, it shows highly negative correlation with -0.86 and with LMA, it shows positive correlation with 0.43.
Looking at the heritability of each breed from breeding swine that have low kinship connectivity between breeds, heritability of Landrace from the population that’s in the Swine Genetic Improvement Network Program in ADG, 90KG, BF, LMA and LP are estimated to be 0.43, 0.42, 0.51, 0.20, 0.49 respectively, that of Yorkshire in ADG, 90KG, BF, LMA and LP are estimated to be 0.39, 0.39, 0.42, 0.25, 0.46 respectively, and that of Duroc in ADG, 90KG, BF, LMA and LP are estimated to be 0.42, 0.43, 0.36, 0.22, 0.39 respectively.
Summing up the genetic correlation between economic traits of three breeds from the population that is participating in the Swine Genetic Improvement Network Program, the correlation between LMA and LP show highly positive correlation with 0.43~0.47 and that of between ADG and 90KG as well as BF and LP show extremely high negative correlation with -0.99 and -0.88~-0.92. In terms of phenotype correlation, the correlation between LMA and LP show highly positive correlation with 0.25~0.32 and that of between ADG and 90KG show extremely high negative correlation with -0.98 and that of between BF and LP show highly negative correlation with -0.35~-0.40.
Regarding Landrace of non participating population, estimated heritability in ADG, 90KG, BF, LMA and LP are 0.49, 0.51, 0.48, 0.23, 0.4 respectively, those of Yorkshire are estimated to be 0.43, 0.41, 0.43, 0.22, 0.43, and those of Duroc are estimated to be 0.45, 0.48, 0.42, 0.19, 0.44 respectively.
Summing up the genetic correlation between economic traits in the non participating population, the correlation between LMA and LP show highly positive correlation with 0.44~0.47 and that of between ADG and 90KG as well as BF and LP show extremely high negative correlation with -0.99 and -0.90~-0.91. In terms of phenotype correlation, the correlation between LMA and LP show highly positive correlation with 0.40~0.42 and that of between ADG and 90KG show extremely high negative correlation with -0.97~- 0.98 and that of between BF and LP show highly negative correlation with -0.34~-0.46.