Regulation role in gene expression of the c.-2894G>A locus on the 5’ promotor region in the porcine PPARGC1A gene

Research Article
Jun-Mo Kim*

Abstract

The genomic variation of the porcine PPARGC1A 5’ upstream region was identified and new DNA polymorphisms in the region are described. Among the polymorphisms, c.-2894G>A is considered to be a suitable molecular marker for the improvement of meat quality and good lean meat production based on the findings in a previous study. The aim of this study was to confirm the effects of the site of the polymorphism on phenotypic traits and to clarify the regulatory role of the PPARGC1A 5’ region. One hundred fifty-seven Berkshire pigs were used for association analysis. Fifty-eight pigs with specific genotypes were used to isolate mRNA from the longissimus dorsi muscle tissues, which were immediately collected from the carcasses 45 minutes after slaughter. The level of PPARGC1A mRNA expression in each single nucleotide polymorphism (SNP), including the c.-2894G>A, c.-2885G>T, and c.-1402A>T sites, was compared between genotypes using real-time quantitative PCR. Finally, to assess whether or not the c.-2894G>A polymorphism affects porcine PPARGC1A gene transcription, the luciferase assay was performed using a constructed 5’ regulatory region within the pGL3 basic vector. The results indicated that the expression of PPARGC1A mRNA significantly differed in the c.-2894G>A site (P < 0.05), and also that the transcription activity was significantly higher with the G allele than the A allele (P < 0.05). Moreover, the SNP had significant effects on phenotypic traits, including muscle fiber characteristics and lean meat production. The meat in the pigs with the GG genotype was leaner and had better lean meat production ability and quality than the meat from pigs with other genotypes (P < 0.05). Thus, it was shown that polymorphisms of the 5’ PPARGGC1A regulatory region regulate gene expression.

Keyword


Introduction

Porcine skeletal muscle consists of muscle fibers; the predominant characteristic of a given muscle is determined by its relative composition of different muscle fiber types (Highley et al., 1999; Morita et al., 2000). Fibers are divided into the following three groups based on the proportions of fiber types: white glycolytic fibers (type IIb); red oxidative fibers (type I); and intermediate fibers (type IIa). The different muscle fibers have different contractile and metabolic properties (Berchtold et al., 2000). In general, a higher percentage of white fibers correlates with the condition of pale, soft and exudative (PSE) pork (Fiedler et al., 1999) and stress susceptibility (Fiedler, 1993). Thus, knowledge of muscle fiber composition is an important element of muscle characteristics and subsequent meat quality.

The peroxisome proliferator-activated receptor-gamma co-activator-1A (PPARGC1A; also referred to as PGC-1a) is a novel transcription co-activator of many nuclear hormone receptors, including peroxisome proliferator-activated receptor-gamma (PPARγ). PPARGC1A is expressed in skeletal muscle, and potently induces mitochondrial biogenesis when expressed ectopically in skeletal and cardiac myocytes (Lehman et al., 2000). PPARGC1A is also critically involved in other aspects of energy metabolism, such as adaptive thermogenesis in brown fat and hepatic gluconeogenesis (Yoon et al., 2001). The particularly robust role of PPARGC1A in mitochondrial biogenesis, and the fact that mitochondrial metabolism is viewed as a critical part of the muscle fiber type phenotype, suggested a potential role for PPARGC1A in the control of specific muscle fiber types which can induce type I fiber formation (Lin et al., 2002).

PPARGC1A mRNA is found in tissues that have high energy demands and are rich in mitochondria, such as heart, skeletal muscle, brown adipose tissue, kidney, liver, and to a lesser extent, white adipose tissue, pancreas, and brain (Esterbauer et al., 1999; Larrouy et al., 1999; Wu et al., 1999). Expression of PPARGC1A mRNA is elevated upon cold exposure in brown fat (Puigserver et al., 1998) and is readily inducible by exercise training in skeletal muscle (Baar et al., 2002). The subsequent activation of calcium signaling pathways appears to play a major role in the stimulation of PPARGC1A transcription through calcineurin and calcium-dependent protein kinases (Wu et al., 2002), which culminate in the activation of several transcription factors, such as cAMP-responsive element binding (CREB) and MEF2, in a feed-forward loop (Handschin et al., 2003). Moreover, the ectopic expression of PPARGC1A in myotubes stimulates GLUT4 expression and mitochondrial oxidative metabolism (Michael et al., 2001). These types of transcription factors can increase PGC-1a promoter activation, and subsequently lead to similar increases at the level of mRNA (Irrcher et al., 2008; Scarpulla, 2010).

Porcine PPARGC1A was mapped to porcine chromosome 8 (SSC8p21; Pinton et al., 2000). In a recent study, the porcine PPARGC1A gene structure was characterized from cDNA coding sequences (Jacobs et al., 2006). Among reported polymorphisms in the coding region, a single nucleotide polymorphism (SNP) of Cys430Ser site in exon 8 was studied for the associations with muscle fiber characteristics and meat quality (Kim et al., 2010). The polymorphism had marked effects on the number and area composition of fiber type I and the muscle pH value. To confirm the regulatory effects of the PPARGC1A gene on muscle fiber characteristics in pigs, a prior study described in chapter 3 was performed to identify DNA polymorphisms in the 5’ regulatory region using association analysis. The results showed that the polymorphisms have significant effects on muscle fiber characteristics, including fiber type composition and size, which can affect lean meat production and meat quality traits.

Based on a previous study, identifying the transcription factor binding site and an analysis of gene expression levels on newly found polymorphisms in the PPARGC1A 5’ regulatory region were needed to clarify functions of the polymorphic DNA structure. The aim of the current study was to clarify the effects of the functions of the newly found SNPs in the 5’ regulatory region on the levels of gene expression. Thus, the level of mRNA expression by the SNPs was analyzed and variant allele constructs of 5’ regulatory regions were used for analysis of luciferase activities.

Materials and methods

Animals, genotyping, and measuring traits

One hundred fifty-seven pigs of the Berkshire breed were utilized in this study. The pigs were fed the same commercial diet in different pens of the same farm. The pigs were sacrificed during five periods in a commercial abattoir following standard procedures under the supervision of the Korean grading service for animal products. Skeletal muscle tissues from the longssimus dorsi (LD) muscle were collected within 45 minutes after slaughtering. The extraction of genomic DNA from the muscle tissues was accomplished using a DNA isolation kit (G-DexTMIIb, Intronbio). Genotyping was performed on genomic DNA using PCR–RLFP methods determined by previous studies of this thesis. Moreover, every phenotypic trait was measured using the same methods of the previous study.

Tissues, RNA isolation, and cDNA synthesis

RNAs of the animals were isolated from the LD muscle tissues, which were immediately collected from the carcasses 45 minutes after slaughter and used for gene expression analyses. Muscle specimens for gene expression analysis were collected and snap frozen in liquid nitrogen. Total RNA was isolated from ~80 mg of skeletal muscle tissue using TRIzol reagent (Invitrogen), according to the manufacturer’s protocol. The integrity of total RNA was checked by running a 0.7% agarose gel and the concentration was determined using a spectrophotometer (Eppendorf Co.). Approximately 2 ㎍ of total RNA was mixed with 2 ㎕ of oligo(dT)18 (0.25 ㎍/㎕), 4 ㎕ of dNTPs (2.5 mM each), and 5.4 ㎕ of RNase-free ddH2O, and incubated at 65 °C for 5 min, placed in an ice bath for 2 min, then 4 ㎕ of 5X First-Strand buffer, 1 ㎕ of DTT (0.1 M), 1 ㎕ of RNase inhibitor (40 U/㎕), and 0.6 ㎕ of Superscript III reverse transcriptase (200 U/㎕; Invitrogen) were added and incubated at 50 °C for 55 min and 70 °C for 15 min in the PCR machine (Mastercycler gradient; Eppendorf Co.). The synthesized cDNA samples were stored at 20 °C.

Real-time reverse-transcription PCR

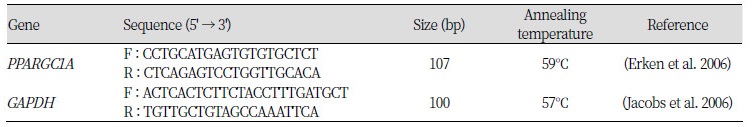
The mRNA of PPARGC1A was normalized to GAPDH of individual animals with different genotypes as determined by real-time quantitative reverse-transcription PCR (RT-PCR) on a CFX-96 machine (Bio-Rad). For the reaction, 3.0 ㎕ of ddH2O, 5 ㎕ of 2× SYBR Premix Ex TaqII (TaKaRa), 0.4 ㎕ of each forward and reverse primer (Table 1), 0.2 ㎕ of 50× Rox Reference DyeII, and 1.0 ㎕ of cDNA at a dilution of 1:5 were mixed and heated initially at 95 °C for 30 s to activate the reaction. Subsequent PCR reactions were carried out at 95 °C for 5 s and 60 °C for 30 s for 40 cycles. The relative expression of the PPARGC1A gene was analyzed according to the 244−△△Ct method (Livak and Schmittgen, 2001) using the GAPDH gene for normalization.

Table 1. Specific primer sets for analyses of real-time PCR http://dam.zipot.com:8080/sites/jabg/images/N0270020203_image/Table_JABG_02_02_03_T1.jpg

Plasmids

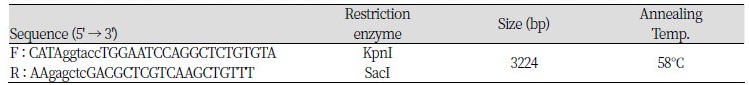
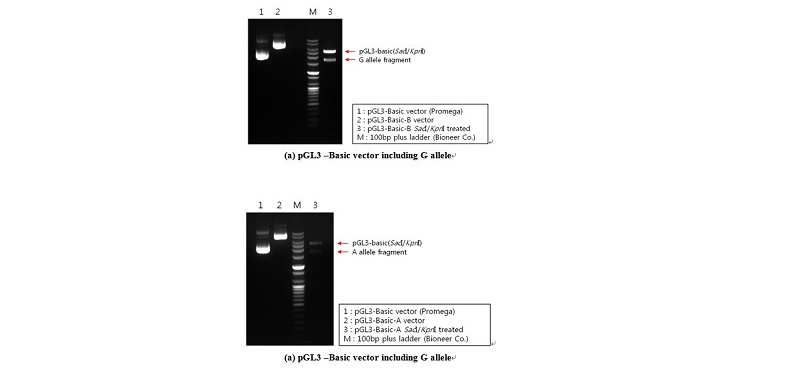
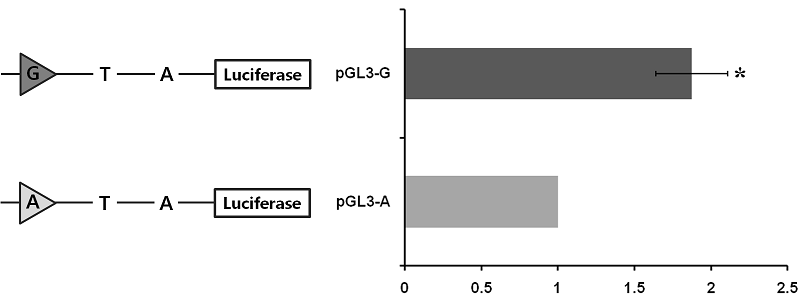
Based on genotyping results, genomic DNA isolated from selected animals at the c.-2894G>A site with homozygous GG and AA genotypes was used as a template for constructing plasmids (pGL3-G and pGL3-A, respectively). A DNA fragment that covered one polymorphic site (c.-2894G>A) ranging from -3238 to -14 (relative to initiation codon ATG) of the 5’ regulatory region of the porcine PPARGC1A gene was used. The specific primer set was used for constructing vectors pGL3- G and -A was contained in the SacI (forward primer) and KpnI (reverse primer) restriction sites (Table 2). The PPARGC1A 5’ regulatory region, including the G and A alleles on c.-2894G>A, was amplified by PCR with Prime Taq DNA polymerase (5 U/㎕; Genet Bio.), and was ligated into the pGL3-basic vector (Promega), as indicated in Figure 1.

Table 2. Specific primer sets which have a restriction enzyme site for analysis by the luciferase assay http://dam.zipot.com:8080/sites/jabg/images/N0270020203_image/Table_JABG_02_02_03_T2.jpg
http://dam.zipot.com:8080/sites/jabg/images/N0270020203_image/Figure_JABG_02_02_03_F1.jpg
Figure 1

Constructions of PPARGC1A 5’ regulatory region, including G and A alleles on c.-2894G>A within pGL3 basic vectors for luciferase analysis. The length of each allele fragment is 3224 bp.

Cell culture, transfection, and luciferase assay

Murine C2C12 cells were maintained in Dulbecco’s modified Eagle medium (DMEM; Gibco, Invitrogen) supplemented with 10% fetal bovine serum (Gibco, Invitrogen), and 100 U/100 ㎍ (final concentration) of penicillin/streptomycin (pen/strep). When the cells reached 90% confluence, the proliferation medium was removed and the cells were rinsed with phosphate-buffered saline (PBS), and treated for 2 min with 0.25 % trypsin to detach cells. Cells were collected, centrifuged, and diluted in proliferation medium prepared with DMEM without pen/strep and split onto two gelatin-coated 24-well plates at a density of ~105 cells per well. The following day, the cells were transfected with Lipofectamine 2000 (Invitrogen) according to the manufacturer’s instructions. Briefly, for each well, 2.0 ㎕ of Lipofectamine 2000 and 0.8 ㎍ of plasmid DNA were mixed in 100 ㎕ of FBS- and pen/strep-free Opti-MEM I medium (Promega) for 20 min. To normalize the transfection efficiency, pRLtk (Promega), which carries a renilla luciferase gene, was co-transfected with the reporter construct, as shown above. The experiments were performed in two replicates for each construct. The transfection mixture was allowed to remain on cells for 2 h until they reached confluence, then the mixture media was removed. The transfected cells were cultured over 2 d. To harvest the cultured cells, the cells on the plate were treated with the passive lysis buffer (Promega) after washing twice with PBS, followed by agitation for 30 min on an orbital shaker with gentle shaking to ensure complete and even coverage of the cell monolayer with 1X passive lysis buffer (Promega). Luciferase activities were measured using the Multilabel Plate Reader (Perkin Elmer) in accordance with the manufacturer’s protocol. The firefly luciferase activities were normalized by the renilla luciferase activities in each well. The data given in the Results section are the average of three replicates. Data are expressed as the mean ± standard error.

Statistical analysis

The association analyses between single SNPs and measured traits were performed with a statistical model using GLM procedures (SAS 9.2; SAS Institute Inc.). In this model, sex, slaughter period, and marker genotypes were included as fixed variables and the carcass body weight as a covariate. The results are presented as the least squares means together with standard errors. Due to a small percentage ( ≤ 20%) of type I and IIa fibers, and a large percentage ( ≥ 80%) of type IIb fibers, the total number of fibers was calculated using logarithmic transformation, while the muscle fiber compositions were estimated using angular transformation.

The GLM procedure was used for analysis of real-time PCR levels among genotypes. The model was the same as the model for association analysis without carcass body weight as a covariate. Differences were considered significant at a P < 0.05. The data are expressed as the mean ± standard error. Significant differences between the two constructed alleles for the luciferase assay were detected by t-test.

Results

Genotypic frequencies and effects on phenotypic traits

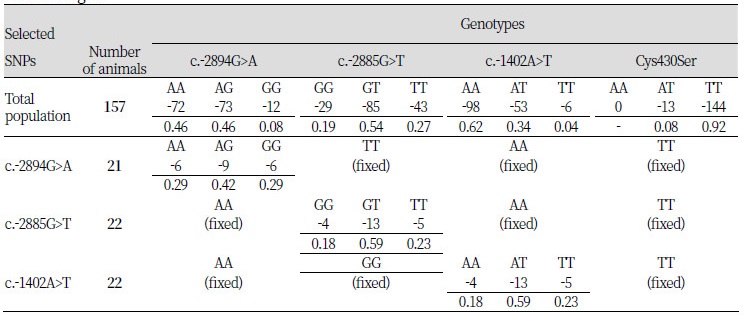
To clarify the effects of each polymorphism in the PPARGC1A 5’ regulatory region on the level of gene expression, 58 animals with dependent genotypes from each polymorphic site were selected from the 157 pigs of the Berkshire population (Table 3). Hence, 21 of 58 selected pigs had only 1 polymorphism at the c.-2894G>A site with fixed c.-2885G>T, c.-1402A>T, and Cys430Ser polymorphic sites. At the c.-2885G>T and c.-1402A>T sites, 22 pigs each were selected that had only 1 polymorphism at each site the other sites fixed with the same genotype frequencies in each selected population. Heterozygote genotypes at every polymorphic site were higher frequencies than homozygote genotypes. At the Cys430Ser site, there were no AA-genotype animals, and the frequency of AT-genotype animals in the Berkshire population was too small. For this reason, an association analysis was not performed at the Cys430Ser polymorphic site.

Table 3. Genotypic frequencies of the selected animals in the Berkshire pigs by each polymorphism of the PPARGC1A gene http://dam.zipot.com:8080/sites/jabg/images/N0270020203_image/Table_JABG_02_02_03_T3.jpg

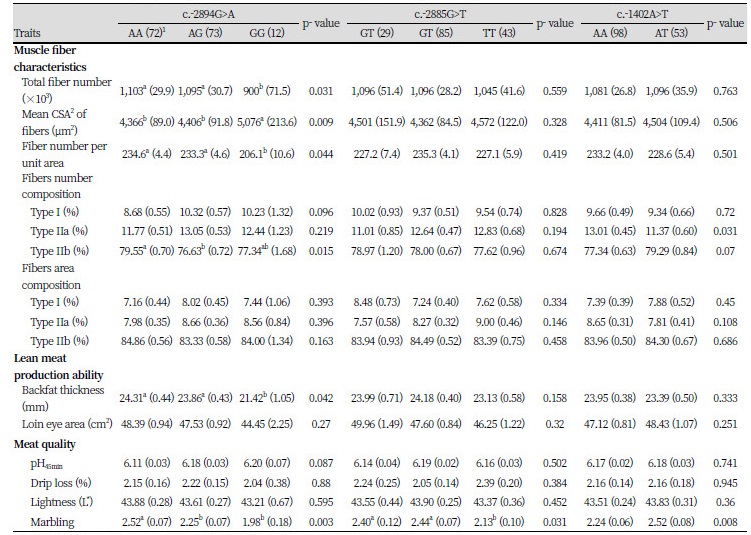
To confirm the effects of the studied SNPs on phenotypic traits in the studied population that was the Berkshire breed, association analysis was performed between genotypes for each SNP and measured traits, including muscle fiber characteristics, lean meat production, and meat quality (Table 4). The SNP at the c.-2894G>A site had significant effects on most of muscle fiber characteristics, excluding fiber\ area composition. The results showed that there were significant differences among genotypes in total muscle fiber number (P < 0.05), mean cross-sectional area (CSA) of fibers (P < 0.01), fiber number per unit area (P < 0.05), and fiber types I (P < 0.10) and IIb (P < 0.05) number composition. The genotypes were shown to have effects on variation in lean meat production ability with backfat thickness and meat quality with pH value (P < 0.05) and marbling score (P < 0.05).

Based on the results of association analysis of the c.-2885G>T and c.-1402A>T sites, most of the muscle fiber characteristics and lean meat production were not significantly different between genotypes, excluding the fiber types IIa (P < 0.05) and IIb (P < 0.05) composition of the c.-1402A>T site; however, both showed significant differences among genotypes in marbling score (P < 0.05 and P < 0.01, respectively).

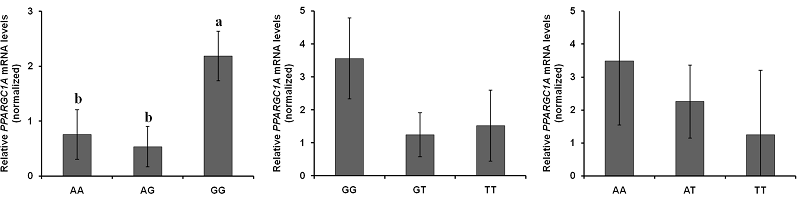
Comparison of PPARGC1A mRNA expression among the genotypes

The expression of PPARGC1A mRNA in each of the SNP was compared between genotypes (Figure 2). The level of mRNA expression at the c.-2894G>A site [Figure 2(a)] was significantly different between genotypes; the GG genotype was relatively lower than the AA and AG genotypes (P < 0.05, = 0.0299).

http://dam.zipot.com:8080/sites/jabg/images/N0270020203_image/Figure_JABG_02_02_03_F2.jpg
Figure 2

Comparison of mRNA expression of the c.-2894G>A locus in the porcine PPARGC1A by the real-time qPCR. Different superscript (a or b) above the error bar is a significant difference between genotypes on the SNP site (P < 0.05).

Comparison of the promoter regions of PPARGC1A harboring different genotypes in driving transcription

To assess whether or not the c.-2894G>A site affects porcine PPARGC1A gene transcription, the 3224 bp fragment spanning the 5’ regulatory region from -3238 to -14 (relative to initiation codon ATG) was cloned and linked to a pGL3 luciferase reporter construct. Two constructs differing only at site c.-2894G>A were obtained, two of which harbored the identified genotypes (pGL3-G and pGL3-A). The promoter activity of these constructs was assessed by transient transfection of the individual reporter constructs into C2C12 cells. As shown in Figure 3, the activity of pGL3-G in driving reporter gene transcription was significant (1.87-fold greater than pGL3-G).

Discussions

In the previous chapter, the genomic sequence and structure of the porcine PPARGC1A 5’ upstream region was identified and DNA polymorphisms in the region were newly found (see Chapter III). Although which tissues express PPARGC1A has been identified and what are the effects of sequence polymorphisms (Jacobs et al., 2006; Kunej et al., 2005), the relative expression of mRNA when comparing genotypes in each polymorphism in skeletal muscle tissue is unknown in the pig. Because this knowledge is essential in researching differences in PPARGC1A regulation in view of selection for improved muscle fiber formation and meat quality by using specific DNA markers, the expression of mRNA was compared among genotypes on the newly found three SNPs in the porcine PPARGC1A 5’ upstream region. Moreover, the luciferase assay was performed to clarify the transcription activity according to the SNP at the c.-2894G>A site which had a significantly different level of mRNA expression among genotypes. The current results not only clearly indicate that the expression of PPARGC1A mRNA was significantly differ at the c.-2894G>A site (P < 0.05; Figure 2), but also that the transcription activity was significantly higher with the G allele than the A allele (P < 0.05; Figure 3). Moreover, the SNP had significant effects on phenotypic traits, including muscle fiber characteristics, lean meat production, and meat quality with had better lean meat and quality in the GG genotype than the other types (Table 4, Chapter III).

Table 4. Effects of polymorphisms of the 5’ PPARGC1A gene on phenotypic traits in Berkshire pigs http://dam.zipot.com:8080/sites/jabg/images/N0270020203_image/Table_JABG_02_02_03_T4.jpg

1 The number of animals is indicated between parentheses. 2CSA, cross-sectional area

Least-square means and their standard errors within a row with no common superscript letter differ significantly (p < 0.05)

http://dam.zipot.com:8080/sites/jabg/images/N0270020203_image/Figure_JABG_02_02_03_F3.jpg
Figure 3

Transcriptional luciferase activity of two constructs (pGL3-G and A). The asterisk beside error bar is a significant difference between the two alleles.

The aim of this study was to clarify the regulation roles of the PPARGC1A 5’ region. Previous studies reported that PPARGC1A is induced by mitochondrial biogenesis-inducing stimuli, as well as contractile activity in vivo and in vitro in skeletal muscle (Baar et al., 2002; Pilegaard et al., 2003). Moreover, low levels of expression of PPARGC1A in muscle have been associated with defects in energy metabolism, in addition to reduced mitochondrial content and function (Leone et al., 2005; Mootha et al., 2003). The importance of PPARGC1A in regulating mitochondrial content and function suggests that further investigation into the regulation of PPARGC1A gene expression is warranted, particularly under conditions in which mitochondrial biogenesis, such as oxidative energy metabolism and muscle fiber specification, is induced. Hence, the regulation of PPARGC1A expression is closely related to muscle fiber formation and meat condition. Based on the current results, the roles of the porcine PPARGC1A 5’ regulatory region in gene expression has been clarified. Moreover, the polymorphisms in the 5’ regulatory region can regulate gene expression.

The porcine PPARGC1A 5’ regulatory region did not contain transcription factors for binding of typical consensus sequences, such as the TATA and CAAT boxes. However, the TATA-less sequence housed putative consensus sites, including a GC-box, a CRE, binding sites for GATA, MEF2, GLUT4, and many E-Box binding proteins (Irrcher et al., 2008). The important transcription factors, such as MEF2 and CREB in skeletal muscle, are co-activated by PPARGC1A expression (Handschin et al., 2003). The c.-2894G>A polymorphic site is selectively recognized by the transcription factor, CREB protein, according to different alleles. Thus, it can be considered a meaningful transcription factor binding site and a strong evidence for gene expression regulation factor. However, further progressive analysis is needed to confirm the interaction between PPARGC1A and transcription factor, such as CREB, and the critical role of SNP in the regulation of interactions with specific transcription factors.

References

1  Amer, P. R. 1992. Estimation of economic weights in genetic improvement using neo-classical production theory: an alternative to rescaling. Anim. Prod. 54: 341-350. 

2  Amer, P. R. 1994. Economic theory and breeding objectives. 5th World Congr. Genet. Appl. Livest. Prod. 18: 197-207. 

3  Andersson, L. 2001. Genetic dissection of phenotypic diversity in farm animals. Nat. Rev. Genet. 2: 130-138. 

4  Andersson, L. et al. 1994. Genetic mapping of quantitative trait loci for growth and fatness in pigs. Science 263: 1771-1774. 

5  Archibald, A. L. et al. 1995. The PiGMaP consortium linkage map of the pig (Sus scrofa). Mamm. Genome 6. 

6  Baar, K. et al. 2002. Adaptations of skeletal muscle to exercise: rapid increase in the transcriptional coactivator PGC-1. FASEB J 16: 1879-1886. 

7  Berchtold, M. W., H. Brinkmeier, and M. Muntener. 2000. Calcium Ion in Skeletal Muscle: Its Crucial Role for Muscle Function, Plasticity, and Disease. Physiol. Rev. 80: 1215-1265. 

8  Bidanel, J. P., and M. F. Rothschild. 2002. Current status of quantitative trait loci mapping in pigs. Pig News Inf. 23: 39-54. 

9  Blangero, J., S. Williams-Blangero, C. M. Kammerer, B. Towne, and L. W. Konigsberg. 1992. Multivariate genetic analysis of nevus measurements and melanoma. Cytogenet. Cell Genet. 59: 179-181. 

10  Brascamp, E. W., C. Smith, and D. R. Guy. 1985. Derivation of economic weights from profit equations. Anim. Prod. 40: 175-180. 

11  Brocks, L. et al. 2000. The effects of selection of pigs on growth rate vs leanness on histochemical characteristics of different muscles. J. Anim. Sci. 78: 1247-1254. 

12  Brooke, M. H., and K. K. Kaiser. 1970a. Muscle fiber types: How many and what kind? Arch. Neurol. 23: 369-379. 

13  Brooke, M. H., and K. K. Kaiser. 1970b. Three myosin adenosine triphosphatase system: the nature of their pH liability and sulphydryl dependence. J. Histochem. Cytochem. 18: 670-672. 

14  Brookes, A. J. 1999. The essence of SNPs. Gene 234: 177-186. 

15  Cameron, N. D. 1990. Genetic and phenotypic parameters for carcass traits, meat and eating quality traits in pigs. Livest. Prod. Sci. 26: 119-135. 

16  Chang, K. C., K. Fernandes, and P. D. Chantler. 1995. Cloning and in vivo expression of the pig MyoD gene. J. Muscle Res. Cell Motil. 16: 243-247. 

17  Cheverud, J. M., and E. Routman. 1993. Quantitative trait loci: individual gene effects on quantitative characters. J. Evol. Biol. 6: 463-480. 

18  Cieslak, B. D., W. Kapelaski, T. Blicharski, and M. Pierzcha!a. 2000. Restriction fragment length polymorphisms in myogenin and myf3 genes and their influence on lean meat content in pigs. J. Anim. Breed. Genet. 117: 43-55. 

19  Clark, A. J. 1998. Animal Breeding: technology for the 21st century. Harwood academic publishers. 

20  Darvasi, A. 1998. Experimental strategies for the genetic dissection of complex traits in animal models. Nat. Genet. 18: 19-24. 

21  Davis, R. L., P. F. Cheng, A. B. Lassar, and H. Weintraub. 1990. The MyoD DNA binding domain contains a recognition code for muscle-specific gene activation. Cell 60: 733-746. 

22  De Vries, A. G., A. Sosnicki, J. P. Garnier, and G. S. Plastow. 1998. The role of major genes and DNA technology in selection for meat quality in pigs. Meat Sci. 49: S245-S255. 

23  Dickerson, G. E. 1970. Efficiency of animal production - molding the biological components. J. Anim. Sci. 30: 849-859. 

24  Dodgson, J. B., H. H. Cheng, and R. Okimoto. 1997. DNA marker technology: a revolution in animal genetics. Poult. Sci. 76: 1108-1114. 

25  Dwyer, C. M., N. C. Stickland, and J. M. Fletcher. 1994. The influence of maternal nutrition on muscle fiber number development in the porcine fetus and on subsequent postnatal growth. J. Anim. Sci. 72: 911-917. 

26  Erkens, T. et al. 2006. Development of a new set of reference genes for normalization of real-time RT-PCR data of porcine backfat and longissimus dorsi muscle, and evaluation with PPARGC1A. BMC Biotechnol. 6: 41. 

27  Ernst, C. W., D. A. Vaske, R. G. Larson, and M. F. Rothschild. 1993. Rapid communication: MspI restriction fragment length polymorphism at the swine myogenin locus. J. Anim. Sci. 71: 3479-. 

28  Essen-Gustavsson, B., A. Karlsson, K. Lundstrom, and A. C. Enfalt. 1994. Intramuscular fat and muscle fibre lipid contents in halothane-gene-free pigs fed high or low protein diets and its relation to meat quality. Meat Sci. 38: 269-277. 

29  Esterbauer, H., H. Oberkofler, F. Krempler, and W. Patsch. 1999. Human Peroxisome Proliferator Activated Receptor Gamma Coactivator 1 (PPARGC1) Gene: cDNA Sequence, Genomic Organization, Chromosomal Localization, and Tissue Expression. Genomics 62: 98-102. 

30  Ewing, B., L. Hillier, M. C. Wendl, and P. Green. 1998. Base-Calling of Automated Sequencer Traces Using Phred.I. Accuracy assessment. Genome Res. 8: 175-185. 

31  Fiedler, I., G. Dietl, C. Rehfeldt, J. Wegner, and K. Ender. 2004. Muscle fibre traits as additional selection criteria for muscle growth and meat quality in pigs - results of a simulated selection. J. Anim. Breed. Genet. 121: 331-344. 

32  Fiedler, I. et al. 1999. Structural and functional characteristics of muscle fibres in pigs with different malignant hyperthermia susceptibility (MHS) and different meat quality. Meat Sci. 53: 9-15. 

33  Fiedler, I., Ender, K., Wicke, M., von Lengerken, G.,. 1993. Relationships between micro-structure of muscle tissue and stress susceptibility in Landrace pigs (halothane sensitivity). Arch. Anim. Breed. 36: 525-538. 

34  Fiedler, I., K. Nurnberg, T. Hardge, G. Nurnberg, and K. Ender. 2003. Phenotypic variations of muscle fibre and intramuscular fat traits in Longissimus muscle of F2 population DurocxBerlin Miniature Pig and relationships to meat quality. Meat Sci. 63: 131-139. 

35  G. A. Rohrer, R. M. Thallman, S. Shackelford, T. Wheeler, and M. Koohmaraie. 2006. A genome scan for loci affecting pork quality in a Duroc-Landrace F2 population. Anim. Genet. 37: 17-27. 

36  Gerber, A. N., T. R. Klesert, D. A. Bergstrom, and S. J. Tapscott. 1997. Two domains of MyoD mediate transcriptional activation of genes in repressive chromatin: a mechanism for lineage determination in myogenesis. Genes dev. 11: 436-450. 

37  Gordon, D., C. Abajian, and P. Green. 1998. Consed: A Graphical Tool for Sequence finishing. Genome Res. 8: 195-202. 

38  Goureau, A. et al. 1996. Human and porcine correspondence of chromosome segments using bidirectional chromosome painting. Genomics 36: 252-262. 

39  Haley, C. S., and L. Andersson. 1997. Linkage mapping of quantative trait loci in plants and animals. Oxford University Press. 

40  Handschin, C., J. Rhee, J. Lin, P. T. Tarr, and B. M. Spiegelman. 2003. An autoregulatory loop controls peroxisome proliferator-activated receptor γ coactivator 1α expression in muscle. Proc. Natl. Acad. Sci. U. S. A. 100: 7111-7116. 

41  Hasty, P. et al. 1993. Muscle deficiency and neonatal death in mice with a targeted mutation in the myogenin gene. Nature 364: 501-506. 

42  Hawken, R. J. et al. 1999. A first-generation porcine whole-genome radiation hybrid map. Mamm. Genome 10: 824-830. 

43  Henckel, P., A. Karlsson, N. Oksbjerg, and J. Soholm Petersen. 2000. Control of post mortem pH decrease in pig muscles: experimental design and testing of animal models. Meat Sci. 55: 131-138. 

44  Henckel, P., N. Oksbjerg, E. Erlandsen, P. Barton-Gade, and C. Bejerholm. 1997. Histo- and biochemical characteristics of the Longissimus dorsi muscle in pigs and their relationships to performance and meat quality. Meat Sci. 47: 311-321. 

45  Highley, J. R. et al. 1999. The size and fiber composition of the anterior commissure with respect to gender and schizophrenia. Biol. Psychiatry 45: 1120-1127. 

46  Hintz, C. S., E. F. Coyle, K. K. Kaiser, M. Y. Chi, and O. H. Lowry. 1984. Comparison of muscle fiber typing by quantitative enzyme assays and by myosin ATPase staining. J. Histochem. Cytochem. 32: 655-660. 

47  Honikel, K. O. 1987. How to measure the water-holding capacity of meat? Recommendation of standardized methods. Evaluation and control of meat quality in pigs. p 129–142. In P. V. Tarrant, G. Eikelenboom, & G. Monin (Eds.), Dordrecht, The Netherlands: Martinus Nijhoff. 

48  Irrcher, I., V. Ljubicic, A. F. Kirwan, and D. A. Hood. 2008. AMP-activated protein kinase-regulated activation of the PGC-1alpha promoter in skeletal muscle cells. PLoS One 3: e3614. 

49  Jacobs, K. et al. 2006. Porcine PPARGC1A (peroxisome proliferative activated receptor gamma coactivator 1A): coding sequence, genomic organization, polymorphisms and mapping. Cytogenet. Genome Res. 112: 106-113. 

50  Jansen, R. C. 1993. Interval Mapping of Multiple Quantitative Trait Loci. Genetics 135: 205-211. 

51  Jeon, J. T. et al. 2003. A large-insert porcine library with sevenfold genome coverage: a tool for positional cloning of candidate genes for major quantitative traits. Mol. Cells. 16: 113-116. 

52  Jurie, C., B. Picard, and Y. Geay. 1999. Changes in the metabolic and contractile characteristics of muscle in male cattle between 10 and 16 munths of age. Histochem. J. 31: 117-122. 

53  Kapela et al. 2005. Polymorphism in Coding and Non-coding Regions of the MyoD Gene Family and Meat Quality in Pigs. Folia Biologica 53: 45-49. 

54  Karlsson, A. et al. 1993. Muscle histochemical and biochemical properties in relation to meat quality during selection for increased lean tissue growth rate in pigs. J. Anim. Sci. 71: 930-938. 

55  Karlsson, A. H., R. E. Klont, and X. Fernandez. 1999. Skeletal muscle fibres as factors for pork quality. Livest. Prod. Sci. 60: 255-269. 

56  Kim, J. M. et al. 2010. Effects of p.C430S polymorphism in the PPARGC1A gene on muscle fibre type composition and meat quality in Yorkshire pigs. Anim. Genet. 41: 642-645. 

57  Klont, R. E., L. Brocks, and G. Eikelenboom. 1998. Muscle fibre type and meat quality. Meat Sci. 49: S219-S229. 

58  Knoll, A., M. Nebola, J. Dvorak, and S. Cepica. 1997. Detection of a DdeI PCR RFLP within intron 1 of the porcine MYOD1 (MYF3) locus. Anim. Genet. 28: 321. 

59  Knutti, D., and A. Kralli. 2001. PGC-1, a versatile coactivator. Trends Endocrinol. Metab. 12: 360-365. 

60  Kunej, T. et al. 2005. Frequency distribution of a Cys430Ser polymorphism in peroxisome proliferator-activated receptor-gamma coactivator-1 (PPARGC1) gene sequence in Chinese and Western pig breeds. J. Anim. Breed. Genet. 122: 7-11. 

61  Larrouy, D., H. Vidal, F. Andreelli, M. Laville, and D. Langin. 1999. Cloning and mRNA tissue distribution of human PPARgamma coactivator-1. Int. J. Obes. Relat. Metab. Disord. 23: 1327-1332. 

62  Larzul, C. et al. 1997. Phenotypic and genetic parameters for longissimus muscle fiber characteristics in relation to growth, carcass, and meat quality traits in large white pigs. J. Anim. Sci. 75: 3126-3137. 

63  Lehman, J. J. et al. 2000. Peroxisome proliferator-activated receptor gamma coactivator-1 promotes cardiac mitochondrial biogenesis. J. Clin. Invest. 106: 847-856. 

64  Lengerken, G., S. Maak, M. Wicke, I. Fiedler, and K. Ender. 1994a. Suitability of structural and functional traits of skeletal muscle for genetic improvement of meat quality in pigs. Arch. Tierz. 37: 133–143. 

65  Lengerken, G., M. Wicke, and S. Maak. 1997. Stress susceptibility and meat quality-situation and prospects in animal breeding and research. Arch. Anim. Breed. 40 (Suppl): 163-171. 

66  Lengerken, G. v., S. Maak, M. Wicke, I. Fiedler, and K. Ender. 1994b. Suitability of structural and functional traits of skeletal muscle for genetic improvement of meat quality in pigs. Arch. Tierz. 37: 133–143. 

67  Leone, T. C. et al. 2005. PGC-1α Deficiency Causes Multi-System Energy Metabolic Derangements: Muscle Dysfunction, Abnormal Weight Control and Hepatic Steatosis. PLoS Biol. 3: e101. 

68  Lin, J., C. Handschin, and B. M. Spiegelman. 2005. Metabolic control through the PGC-1 family of transcription coactivators. Cell Metab. 1: 361-370. 

69  Lin, J. et al. 2002. Transcriptional co-activator PGC-1[alpha] drives the formation of slow-twitch muscle fibres. Nature 418: 797-801. 

70  Liu, M. et al. 2008a. Association of MYF 5 and MYOD 1 Gene Polymorphisms and Meat Quality Traits in Large White × Meishan F2 Pig Populations. Biochem. Genet. 46: 720-732. 

71  Liu, M. et al. 2008b. Association of MYF5 and MYOD1 gene polymorphisms and meat quality traits in Large White x Meishan F2 pig populations. Biochem. Genet. 46: 720-732. 

72  Livak, K. J., and T. D. Schmittgen. 2001. Analysis of relative gene expression data using real-time quantitative PCR and the 2(-Delta Delta C(T)) Method. Methods 25: 402-408. 

73  Lowell, B. B., and B. M. Spiegelman. 2000. Towards a molecular understanding of adaptive thermogenesis. Nature 404: 652-660. 

74  Maltin, C. A. et al. 1997. Pig muscle fibre characteristics as a source of variation in eating quality. Meat Sci. 47: 237-248. 

75  Michael, L. F. et al. 2001. Restoration of insulin-sensitive glucose transporter (GLUT4) gene expression in muscle cells by the transcriptional coactivator PGC-1. Proc. Natl. Acad. Sci. U. S. A. 98: 3820-3825. 

76  Miller, L. R., V. A. Garwood, and M. D. Judge. 1975. Factors Affecting Porcine Muscle Fiber Type, Diameter and Number. J. Anim. Sci. 41: 66-77. 

77  Montarras, D. et al. 1991. Developmental patterns in the expression of Myf5, MyoD, myogenin, and MRF4 during myogenesis. New Biol. 3: 592-600. 

78  Mootha, V. K. et al. 2003. PGC-1alpha-responsive genes involved in oxidative phosphorylation are coordinately downregulated in human diabetes. Nat. Genet. 34: 267-273. 

79  Morita, S. et al. 2000. Heterogeneous composition of histochemical fibre types in the different parts of M. longissimus thoracis from Mishima (Japanese native) steers. Meat Sci. 54: 59-63. 

80  Olson, E. N. 1990. MyoD family: a paradigm for development? Genes dev. 4: 1454. 

81  Ozawa, S. et al. 2000. The characteristics of muscle fiber types of longissimus thoracis muscle and their influences on the quantity and quality of meat from Japanese Black steers. Meat Sci. 54: 65-70. 

82  Pette, D., and R. S. Staron. 1990. Cellular and molecular diversities of mammalian skeletal muscle fibers. Rev. Physiol. Biochem. Pharmacol. 120: 115-202. 

83  Picard, B. et al. 1999. Electrophoretic separation of bovine muscle myosin heavy chain isoforms. Meat Sci. 53: 1-7. 

84  Pilegaard, H., B. Saltin, and P. D. Neufer. 2003. Exercise induces transient transcriptional activation of the PGC-1alpha gene in human skeletal muscle. J. Physiol. 546: 851-858. 

85  Pinton, P., L. Schibler, E. Cribiu, J. Gellin, and M. Yerle. 2000. Localization of 113 anchor loci in pigs: improvement of the comparative map for humans, pigs, and goats. Mamm. Genome 11: 306-315. 

86  Ponzoni, R. W. 1988. The derivation of economic valures combining income and expense in different ways: An example with Australian Merino sheep. J. Anim. Breed. Genet. 105: 143-153. 

87  Puigserver, P. et al. 1998. A Cold-Inducible Coactivator of Nuclear Receptors Linked to Adaptive Thermogenesis. Cell 92: 829-839. 

88  Rehfeldt, C., I. Fiedler, G. Dietl, and K. Ender. 2000. Myogenesis and postnatal skeletal muscle cell growth as influenced by selection. Livest. Prod. Sci. 66: 177-188. 

89  Rehfeldt, C., N. C. Stickland, I. IFiedler, and J. Wegner. 1999. Environmental and Genetic Factors as Sources of Variation in Skeletal Muscle Fibre Number. Basic Appl. Myol. 9: 235-253. 

90  Rohrer, G. A. et al. 1996. A comprehensive map of the porcine genome. Genome Res. 6: 371-391. 

91  Rosen, E. D., and B. M. Spiegelman. 2000. MOLECULAR REGULATION OF ADIPOGENESIS. Annual Review of Cell and Developmental Biology 16: 145-171. 

92  Rosser, B. W. C., B. J. Norris, and P. M. Nemeth. 1992. Metabolic capacity of individual muscle fibers from different anatomic locations. J. Histochem. Cytochem. 40: 819-825. 

93  Ruusunen, M., and E. Puolanne. 1997. Comparison of histochemical properties of different pig breeds. Meat Sci. 45: 119-125. 

94  Ryu, Y. C. et al. 2008. Comparing the histochemical characteristics and meat quality traits of different pig breeds. Meat Sci. 80: 363-369. 

95  Ryu, Y. C., and B. C. Kim. 2005. The relationship between muscle fiber characteristics, postmortem metabolic rate, and meat quality of pig longissimus dorsi muscle. Meat Sci. 71: 351-357. 

96  Ryu, Y. C., and B. C. Kim. 2006. Comparison of histochemical characteristics in various pork groups categorized by postmortem metabolic rate and pork quality. J. Anim. Sci. 84: 894-901. 

97  Sambrook, J., E. Fritsch, and T. Maniatis. 1989. Molecular cloning: A laboratory manual Cold spring Harbor Laboratory press. New York 5. 

98  Scarpulla, R. C. 2010. Metabolic control of mitochondrial biogenesis through the PGC-1 family regulatory network. Biochim Biophys Acta. 

99  Smith, C. 1983. Effects of changes in economic weights on the efficiencyh of index selection. J. Anim. Sci. 56: 1057-1064. 

100  Smith, C., J. W. James, and E. W. Brascamp. 1986. On the derivation of economic weights in livestock improvement. Anim. Prod. 43: 545-551. 

101  Soller, M., T. Brody, and A. Genizi. 1976. On the power of experimental designs for the detection of linkage between marker loci and quantitative loci in crosses between inbred lines. TAG Theoretical and Applied Genetics 47: 35-39. 

102  Soumillion, A., J. H. Erkens, J. A. Lenstra, G. Rettenberger, and M. F. te Pas. 1997a. Genetic variation in the porcine myogenin gene locus. Mamm. Genome 8: 564-568. 

103  Soumillion, A. et al. 1997b. Assignment of the porcine loci for MYOD1 to chromosome 2 and MYF5 to chromosome 5. Anim. Genet. 28: 37-38. 

104  Stachowiak, M., M. Szydlowski, J. Cieslak, and M. Switonski. 2006. SNPs in the Porcine PPARGC1a Gene: Interbreed Differences and Their Phenotypic Effects. Cell. Mol. Biol. Lett. 

105  Taber, L. A. 1998. Biomechanical Growth Laws for Muscle Tissue. J. Theor. Biol. 193: 201-213. 

106  Te Pas, M., and A. Visscher. 1994. Genetic regulation of meat production by embryonic muscle formation. a review. J. Anim. Breed. Genet. 111: 404-412. 

107  te Pas, M. F. et al. 1999. Influences of myogenin genotypes on birth weight, growth rate, carcass weight, backfat thickness, and lean weight of pigs. J. Anim. Sci. 77: 2352-2356. 

108  Urbanski, P., J. Kapela ski, M. Bocian, and J. Pierzchala. 2006. An association between the MyoD gene polymorphisms and carcass traits in two-and three-breed crossbred pigs. Anim. Sci. Pap. Rep. 24: 297-303. 

109  Urbanski, P., and J. Kury. 2004. Two new SNPs within exon 1 of the porcine MYOD1 (MYF3) gene and their frequencies in chosen pig breeds and lines. J. Anim. Breed. Genet. 121: 204-208. 

110  van der Werf, J. H. J., K. Marshall, and S. Lee. 2007. Methods and experimental designs for detection of QTL in sheep and goats. Small Ruminant Res. 70: 21-31. 

111  Velarde, A. et al. 2001. Effects of the stunning procedure and the halothane genotype on meat quality and incidence of haemorrhages in pigs. Meat Sci. 58: 313-319. 

112  Verner, J., P. Humpolicek, and A. Knoll. 2007. Impact of MYOD family genes on pork traits in Large White and Landrace pigs. J. Anim. Breed. Genet. 124: 81-85. 

113  Vestergaard, M., N. Oksbjerg, and P. Henckel. 2000. Influence of feeding intensity, grazing and finishing feeding on muscle fibre characteristics and meat colour of semitendinosus, longissimus dorsi and supraspinatus muscles of young bulls. Meat Sci. 54: 177-185. 

114  Visscher, P. M., C. S. Haley, and R. Thompson. 1996. Marker-Assisted Introgression in Backcross Breeding Programs. Genetics 144: 1923-1932. 

115  Wang, Y., and R. Jaenisch. 1997. Myogenin can substitute for Myf5 in promoting myogenesis but less efficiently. Development 124: 2507-2513. 

116  Weintraub, H. 1993. The MyoD family and myogenesis: Redundancy, networks, and thresholds. Cell 75: 1241-1244. 

117  Wernersson, R. et al. 2005. Pigs in sequence space: a 0.66X coverage pig genome survey based on shotgun sequencing. BMC Genomics. 10: 70. 

118  Wright, W. E., D. A. Sassoon, and V. K. Lin. 1989. Myogenin, a factor regulating myogenesis, has a domain homologous to MyoD. Cell 56: 607-617. 

119  Wu, H. et al. 2002. Regulation of Mitochondrial Biogenesis in Skeletal Muscle by CaMK. Science 296: 349-352. 

120  Wu, Z. et al. 1999. Mechanisms controlling mitochondrial biogenesis and respiration through the thermogenic coactivator PGC-1. Cell 98: 115-124. 

121  Wyszynska-Koko, J., and J. Kuryl. 2005. A novel polymorphism in exon 1 of the porcine myogenin gene. J. Appl. Genet. 46: 399-402. 

122  Yerle, M. et al. 1996. A somatic cell hybrid panel for pig regional gene mapping characterized by molecular cytogenetics. Cytogenet. Cell. Genet. 73: 194-202. 

123  Yerle, M. et al. 2002. Generation and characterization of a 12,000-rad radiation hybrid panel for fine mapping in pig. Cytogenet. Genome Res. 97: 219-228. 

124  Yerle, M. et al. 1998. Construction of a whole-genome radiation hybrid panel for high-resolution gene mapping in pigs. Cytogenet. Cell Genet. 82: 182-188. 

125  Yoon, J. C. et al. 2001. Control of hepatic gluconeogenesis through the transcriptional coactivator PGC-1. Nature 413: 131-138. 

126  Yu, T. P., C. K. Tuggle, C. B. Schmitz, and M. F. Rothschild. 1995. Association of PIT1 polymorphisms with growth and carcass traits in pigs. J. Anim. Sci. 73: 1282-1288.