Abstract
Over the years, industry, breeding programs and research initiatives have invested heavily in the phenotyping and genotyping of large numbers of animals across the various SNP platforms. Since sequencing is still relatively expensive and to make the most of the historical data already collected; a widely used strategy is to sequence key representative animals from a population and then use this information to impute the sequence of the others. In this paper, we describe the main steps currently used in the Korean Hanwoo cattle pipeline to impute 50k SNP data up to sequence level assisted by a set of reference animals which were sequenced using Illumina sequencing technology. PLINK, VCFtools, Eagle and Minimac3 are used for the imputation steps. Code and a small example dataset are provided to illustrate the process in practice. This simple roadmap can be used for phasing and imputation of livestock genomic datasets, adding additional value to the datasets already collected across the various platforms.
Acknowledgements
This project was supported by a grant from the Next-Generation BioGreen 21 Program PJ01134906 and PJ012611, Rural Development Administration, Republic of Korea and Australian Research Council (DP130100542). We want to thank Iona Macleod, Bolormaa Sunduimijid and Hans Daetwyler for kindly sharing their broad experience with sequence imputation; we appreciate all the hard work that was needed to underpin a robust imputation strategy.
Figures & Tables
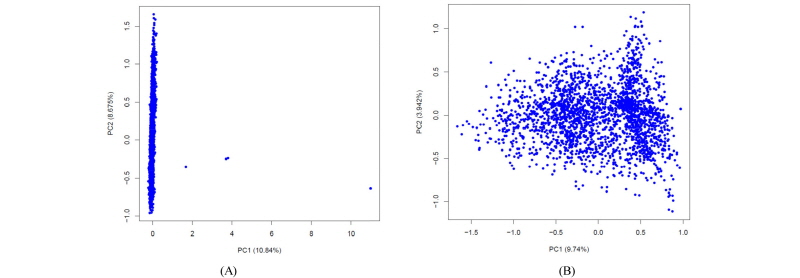
PCA plot of GRM. (a) PCA plot with a few bad samples and (b) PCA plot after removal of the bad samples.