INTRODUCTION
Quail is a species from Coturnix genus that abundant across the lands and it is a bird species who loss the ability to fly with small body size and short shanks (Listiyowati and Roospitasari, 2009). Quail commonly raised in Indonesia is Japanese quail (Coturnix cotunix japonica) with brown and black plumage colors. Plumage color is totally controlled by genetic factor either dominant or recessive (Hutt and Rasmusen, 1982; North 1984). Moreover, plumage color indicates qualitative trait that controlled by one or more genes and alleles (Warwick et al., 1995).
Data obtained from interview of smallholder farmers reported that they are producing final stock of commercial layer quail by mating between brown plumage male and black plumage female. It is conducted to produce brown plumage layer, which is furthermore called as commercial stock by utilizing of crisscross inheritance phenomenon. However, this activity is hereditary conducted to do auto sexing for day old quail (DOQ). Previous study reported that phenomenon of crisscross inheritance between brown plumage male and black plumage female mating system is controlled by the gene encoding black plumage color which is sex linked dominant, therefore, it produces brown female DOQ and black male DOQ (Prihtiyantoro et al., 2001). This mating system is very popular in the smallholder farmers due to very effective and efficient method to separate male and female DOQ in the very early stage of quail life. The study of quail plumage color differences in the basis of molecular genetics in Indonesia is very rare. The characterization of genetic resources is very important to understand the genetic diversity and origin of commercial quail layer. Genetic variation between black and brown plumage quail may be found by evaluating their partial genetic materials such as Mitochondrial (mt) DNA D-loop.
The analysis of mtDNA sequence variation is widely used to evaluate phylogenetic relationships, maternal origins of farm animals, and it is a powerful tool to discriminate animal species (Mindell et al., 1997; Machugh and Bradley, 2001; Wayne et al., 2002). Analysis of mtDNA also shows 99.99% of mtDNA is maternally inherited (Lodish et al., 1998). Mitochondrial DNA D-loop is an effective barcode or small segments of DNA to study genetic variations of species among different populations due to hyper variations within the region (Kawahara et al., 2013). In addition, D-loop is a region of mtDNA that very fast to be evolved and the most polymorphic sites within the region are focused on Hypervariable region 1 (HVR1) and Hypervariable region 2 (HVR2) (Wilkinson-Herbots et al., 1996). These regions can be utilized to characterize genetic diversity and phylogenetic study of black and brown Japanese quail. The objective of this study was to evaluate genetic diversity and phylogenetic study of black and brown Japanese quail based on analysis of mtDNA D-loop sequence and their genetic relationships with Japanese quail in the world.
MATERIALS AND METHODS
Quail population and management
A total of 500 Japanese quails have been raised in this study. The number of quail was equal for every plumage color. Moreover, the female quails were divided into four colony cages with 25 heads per cage. The birds was fed using commercial feed for laying quail containing 18% of crude protein, 3% of calcium, 0.9% of phosphor, and 2700 kcal ME/kg. Each quail accepted around 25 g of feed whereas water was available ad libitum. A lighting was applied for 12 hours/day. All quails in this study were reared under the same environment and management based on standard procedure for raising Japanese quail (Randall and Bolla, 2008).
Blood Collection and DNA Extraction
A total of nine blood samples consisting five black plumage quails and four brown plumage quails have been used in this study. Total of 3 ml of quail blood has been collected with tube containing ethylene diamine tetra acetic acid (EDTA) after they were slaughtered. Furthermore, the blood samples were kept in the freezer at -21oC until used for further analysis. Extraction of DNA has been conducted by putting 20 μl of bloods into 1.5 ml microtube. The DNA extraction process was according to standard procedure of Wizard Genomic DNA Purification Kit (Promega, USA). The extracted DNA was indicated by 0.8% agarose gel electrophoresis stained by ethidium bromide under the UV light.
Design of Primer and Polymerase Chain Reaction (PCR)
Primer design was performed using Primer3 (http://primer3.ut.ee/). The reference sequence used in this study was KX712089.1 obtained from National Center for Biotechnology Information (NCBI) website (https://www.ncbi.nlm.nih.gov/). It represents complete mitochondrion genome of Coturnix japonica. The primer pair was set to cover HVR1,HVR2 and HVR3 regions. The primers are listed in the Table 1.
Polymerase chain reaction was carried out in total volume of 25 μl containing 12.5 μl of GoTaq® Green Master Mix (Promega, USA), 9.5 μl of nuclease free water, 1 μl of each primer, and 1 μl of DNA template. The PCR condition was started from initial denaturation at 95oC for 3 minutes and followed by 35 cycles of denaturation at 95oC for 15 seconds, annealing at 59oC for 30 seconds, and extension at 72oC for 30 seconds. The PCR was completed by final extension at 72oC for 3 minutes. The result of PCR was then checked by 2% agarose gels electrophoresis that stained with ethidium bromide in the Gel documentation (Vilber Lourmat Infinity 1100126M, France). Then, the PCR product was sequenced (1st BASE, Malaysia).
Data Analysis
Sequence of quail mtDNA D-loop was aligned using Clustal Omega program (Thompson et al., 1994), construction of phylogenetic tree was performed using MEGA version 7.0.2.6 (Tamura et al., 2011), the number of haplotype, haplotype and nucleotide diversity was determined using DNAsp version 5.10 (Rozas et al., 2003), and NETWORK version 5.0.0.3 was used for median-joining network profile (Bandelt et al., 1999). The published complete mtDNA D-loop sequences data which are exactly similar region to this study from NCBI were also used in the analysis as parenthesis with following GenBank accession number: AP003195.2, NC_003408.1, NC_004575.1, AB073301.1, NC_023939.1, KF027439.1, KR349185.1, and NC_027279.1. Genetic distance was determined using Kimura 2-parameters model and neighbor-joining (NJ) phylogenetic tree was calculated with 1000 bootstrap resampling (Kimura et al., 2004).
RESULTS AND DISCUSSION
Genetic distance of the populations based on mtDNA D-loop
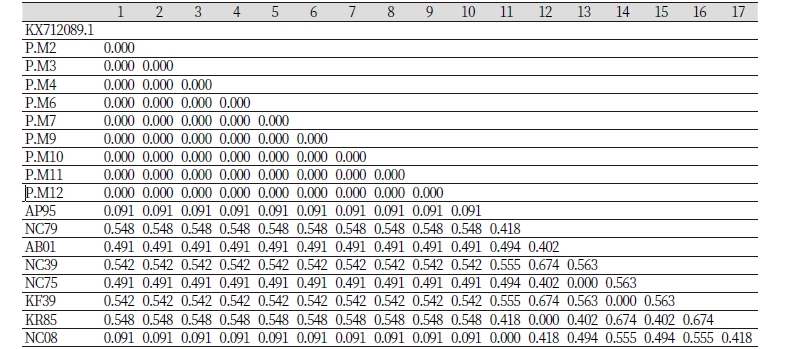
Genetic distance among individual birds within population was ranged from 0.000 to 0.674 (Table 2). It is used as a basis in construction of phylogenetic tree. Genetic distance is the degree of nucleotide differences between populations or species which is calculated by some numerical quantity (Nei, 1987).
Genetic distance of black and brown Japanese quail with published sequences of Japanese quail was ranged 0.000 to 0.091 and the overall average of genetic distance was 0.300. This result suggested that close relationship between Japanese quail around the world has been found in this study. Small value of genetic distance indicated close genetic relationship (Kim et al., 2002; Odahara et al., 2006). On the other hand, genetic distances between black and brown Japanese quail and other bird species such as Coturnix chinensis, Tetraogallus tibetanus and Tetraogallus himalayensis was ranged from 0.491 to 0.548 (Table 2). It suggested that these birds were domesticated from different ancestors (Amano et al., 1981). Nei and Kumar (2000) stated that two or more individuals are not closely related if their values of genetic distance are more than 0.1..
Genetic diversity and haplotype analysis
Genetic diversityand haplotype analysis have been conducted by comparing mtDNA D-loop sequences of Black and Brown Japanese quail with reference sequences downloaded from GenBank database. Overall, information of genetic diversity covers the number of sequence used, polymorphic site, the number of haplotype, haplotype and nucleotide diversities (Table 3).
Data analysis showed nine sequences of Black and Brown Japanese quail were identical. They were also 100% similar with mtDNA D-loop sequence with accession KX712089.1. The number of polymorphic sites, nucleotide and haplotype diversities within Japanese quail population were also very low (Table 3). These results revealed that Japanese quail population was not heterogeneous based on mtDNA D-loop sequence. Low nucleotide and haplotype diversities in this study indicated low genetic diversity within population (Ruo-Yu et al., 2006). In addition, the value of haplotype diversity increased by comparing the sequence data to other bird species obtained from GenBank database. Smith and Chesser (1981) classified h ≥0<0,5 as low haplotype diversity and h >0,5≤1 as high haplotype diversity. In Indonesia, raising Japanese quail to produce egg has been conducted since long time ago, nobody exactly knows when it is introduced to farmers for the first time. The rearing system of Japanese quail is still traditional until now and there is no policy regarding breeding system, therefore the possibility of inbreeding among populations may be occurred. It may cause to low genetic diversity of Black and Brown Japanese quail. Moreover, number and origin of samples have to be improved to get more comprehensive discussion.
Phylogenetic tree and Network profile of Black and Brown Japanese quail
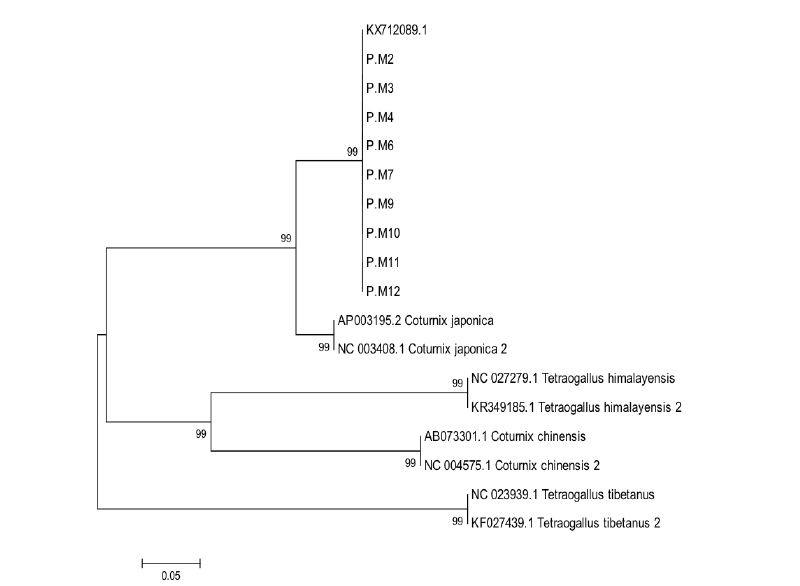
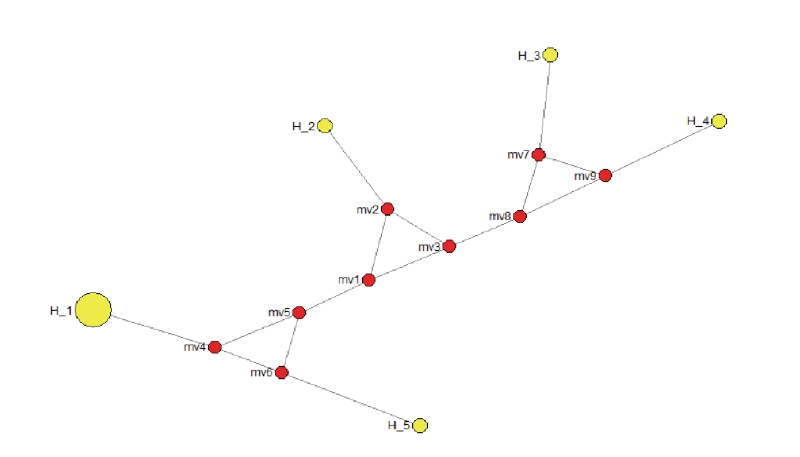
Phylogenetic tree has been constructed using nine sequences of mtDNA D-loop and nine published sequences obtained from NCBI website which are precisely started from similar forward primer and ended by reverse primer designed in this study (Figure 1). The construction of phylogenetic tree showed that Black and Brown Japanese quail are located in the same clade with reference sequence with accession number KX712089.1 whereas two Japanese quails with accession number AP003195.2 and NC_003408.1 were in the sub clade of this clade. This result may be caused different maternal lineage between them since mitochondrial genome is well known maternally inherited and no recombination occurred on it (Hayashi et al., 1985; Herbert et al., 2003). Additionally, Japanese quail was clearly different clade compared to other species of Coturnix. Moreover, the values of bootstrap in the phylogenetic tree constructed in this study was very high about 99% that means the level of confidence set for topology phylogenetic tree was also very high (Batubara et al., 2011; Hall, 2011). In term of network profiling, it has been traced using five haplotypes in accordance to mtDNA D-loop nucleotides used in the analysis (Figure 2). In this current study, Black and Brown Japanese quails were included in haplotype 1 (H_1), two reference sequences of Japanese quail were grouped in haplotype 2 (H_2), and three other species were completely separated from Japanese quail. Each species grouped in different haplotypes. This study found two haplotypes of Japanese quail which is able to be used to discriminate it from other birds, however between Black and Brown Japanese quail was genetically not different based on partial region of mtDNA D-loop. The advantages of using D-loop region of mtDNA in phylogenetic study are due to maternally inherited and no recombination occurred in this region (Herbert et al., 2003). In conclusion, Black and Brown Japanese quails in Indonesia were genetically not different each other based on D-loop region of mtDNA. Two haplotypes have been identified for Japanese quail that makes Japanese quail clearly discriminated form other species of birds used in this study.


