
Dairy Cattle Selection in the Pre-genomic ERA
Pedigree and performance data
Genetic improvement programs for dairy cattle, like most other agricultural species, were built upon a foundation of pedigree information and performance data for selection candidates and their relatives. Recording of ancestry in breed society herdbooks began in the late 1800s, whereas measurement of phenotypes for milk yield and butterfat content began in the early 1900s. In the early years, selection decisions were based on daughter-dam comparisons (Graves, 1925; Yapp, 1925), and bulls for which the performance of their daughters greatly exceeded that of their mates were used more heavily for natural service or, beginning in the 1940s, artificial insemination (AI). Selection index methods (Hazel and Lush, 1942; Lush, 1944) allowed use of data from various types of relatives, but genetic progress was modest until contemporary (herdmate) comparison methods became available (Robertson and Rendel, 1954; Robertson et al., 1956).
Breeding value estimation
Widespread use of AI created large paternal half-sib families that were spread across many herds and a wide variety of management and environmental conditions; this was an ideal situation for progeny testing dairy bulls for sex-limited traits such as milk yield, milk composition, or udder conformation. Statistical methods for computing the estimated breeding value (EBV) of an animal, such as the best linear unbiased prediction (BLUP) sire model (Henderson, 1953; Henderson, 1976) or the modified contemporary comparison (Norman et al., 1976), facilitated accurate sire selection decisions. As computing power increased, implementation of the BLUP animal model, which properly accounted for additive genetic relationships between all animals represented in the pedigree of an animal or its mate, became feasible (Wiggans et al., 1989; VanRaden et al., 1991). The animal model represented a significant advancement for computing the EBV of male and female selection candidates, and statistically it can be represented as: y = Xβ + Zu + e, where y is a vector of phenotypes, X is an incidence matrix that maps phenotypes to management effects, β is a vector of fixed management effects, Z is a incidence matrix that maps phenotypes to animal effects, u is a vector of random animal additive genetic effects, and e is a vector of random residuals, with E(u) ~ N(0,Aσa), where A is a matrix of additive genetic relationships among animals based on pedigree data, E(e) ~ N(0,Iσe), and σa and σe are the additive genetic and residual components of variance, respectively. The relationship matrix, A, typically contains male and female ancestors that do not have performance records of their own, and their EBV are predicted when solving for u.
The costs and benefits of progeny testing
Progeny testing was the norm throughout the latter half of the 20th century, despite some significant limitations. The accuracy of genetic predictions for lactating cows, as measured by reliability (REL), tended to be low. Selection decisions for females less than two years of age (with no lactation records) and males less than five years of age (with no milk-recorded daughters) were made using parent average (PA), which had extremely low REL. For this reason, virtually all young bulls entering AI companies were the offspring of cows ≥ 3 years of age and bulls ≥ 6 years of age. Similarly, more than two-thirds of replacement heifers were sired by bulls ≥ 6 years of age, because farmers were not interested in purchasing semen of young bulls with high PA but very low REL. The long generation intervals in these three paths of selection (sires of males, dams of males, and sires of females) were a major impediment to rapid genetic progress. In addition, AI companies incurred large expenses in purchasing roughly ten young bulls, based on high PA, per each bull that would eventually graduate from progeny testing and have semen marketed to dairy farmers. All of these bulls were housed for three to four nonproductive years, at a major expense to the AI stud, while waiting for their progeny to grow up and complete their first lactation records. Lastly, preferential treatment (special management or nutrition) of young cows with high perceived value caused significant bias in the PA of young animals and EBV of potentially elite cows. These limitations, namely long generation intervals, sex-limited traits, and biased EBV of selection candidates that were housed on commercial farms outside the control of the AI company, created an environment in which a new technology like genomic selection could have a transformative impact on dairy cattle improvement programs.
Opportunities from Sequencing the Bovine Genome
Marker-assisted selection
The promise of marker-assisted selection (Lande and Thompson, 1990; Dekkers, 2004), in which genotypic information from a marker locus linked to a nearby but unknown quantitative trait locus (QTL) is used to enhance the accuracy of selection decisions, lingered for more than two decades. Linkage disequilibrium (LD), a measure of the extent to which the desired marker allele is inherited consistently with the favorable QTL allele, tended to be low given the density of the microsatellite markers that were available at the time. In many cases, such markers were useful only within a full-sib family, in which several offspring from embryo transfer (ET) or in vitro fertilization (IVF) were available and all had identical pedigree-based PA. Furthermore, genome-wide association studies tended to identify only those QTL that had enormous effects on the phenotype, such as DGAT1 (Grisart et al., 2002), due to the stringent significance thresholds that were needed to avoid false positive discoveries when carrying out thousands of statistical comparisons. As a result, the collective QTL that were identified for any given trait explained only a tiny fraction of the total genetic variation for the trait (Visscher, 2008). For these reason, the successes of marker-assisted selection were limited to genetic defects with simple Mendelian inheritance, and its impact on improvement of complex traits that were under the control of multiple genes and biological pathways was negligible.
Whole genome selection
The seminal papers of Nejati-Javaremi et al. (1997) and Meuwissen et al. (2001) postulated that one could compute EBV from genetic markers that would be accurate enough to make routine selection decisions, if a large number of markers were dispersed more or less evenly across all of the chromosomes and the effective population size (Ne) was relatively small. This work laid the foundation for whole-genome selection (WGS) or whole-genome enabled animal selection (WGEAS), but for simplicity the term “genomic selection” is typically used in practice. Sequencing of the bovine genome (Bovine Genome Sequencing and Analysis Consortium, 2009) provided the reference scaffold from which millions of single nucleotide polymorphism (SNP) markers could be identified throughout the genome. These points along the chromosomes at which cows and bulls differ in the A, C, T, G sequence of their genetic code could be potentially useful as markers for genome-based selection decisions. Matukumalli et al. (2009) used this information to design the first widely used commercial DNA microarray, which cost approximately $225 per animal and provided genotypic data for 54,609 SNP markers in a fully automated 48-hour process. This development represented an approximately 1000-fold decrease in the cost of genotyping, and when coupled with large research repositories housing thousands of DNA samples from dairy bulls and milk-recording databases containing millions of performance records from their progeny, dairy geneticists were immediately at the forefront of research and development for genomic selection of farm animals.
Genotype imputation
Recombination events during meiosis break down LD by reshuffling the relationships between adjacent SNP markers, as well as between SNP markers and the nearby QTL, which are typically unknown. However, the number of recombination events per chromosome is relatively small; on average roughly one recombination event occurs per chromosome per generation. This means that long stretches of DNA are passed from one generation to the next, and if a large number of ancestors have been genotyped with a medium-density (typically 50,000 to 100,000 SNPs) or high-density (typically 500,000 to 1,000,000 SNPs) array, it is possible to identify the haploid segments of DNA (haplotypes) that a given animal shares with each of its ancestors and other relatives in the population. Because the number of SNP markers on a medium- or high-density array vastly exceeds the number that are needed to identify or phase the haplotypes inherited by a given calf from its sire and dam, one can consider using low-density arrays (typically 5,000 to 25,000 SNPs) to reduce the cost of genotyping (Habier et al., 2009). This process is called genotype imputation (e.g., Scheet and Stephens, 2006; Howie et al., 2009), and it can be used to infer missing SNPs resulting from failed genotype calls or to combine SNP data from different arrays of similar density. More importantly, it allows one to genotype a calf with an inexpensive ($50 or less) low-density array and infer tens or hundreds of thousands of additional SNP genotypes on a medium- or high-density array for free. Weigel et al. (2010a, 2010b) showed that missing genotypes resulting from the use of low-density arrays could be imputed to medium-density with high accuracy, and that the loss in accuracy of genomic predictions computed with imputed SNP genotypes relative to the actual genotypes was minimal. As a result, dairy farmers now purchase genomic testing for 30,000 to 40,000 calves per month in North America, and vast majority use inexpensive low-density arrays.
Methods for Selection using Whole-genome Markers
The availability of dense whole genome markers provides an opportunity to predict the EBV of young male and female selection candidates that have no progeny or performance data, by matching their genomic test results with those of older bulls and cows that have both genotypic and phenotypic data. The older bulls and cows are typically referred to as the reference population or training set, whereas the young selection candidates are referred to as the validation population or testing set. Conventional statistical models such as multiple linear regression fail in this situation, because the number of SNP markers used as explanatory variables is very large and often exceeds the number of reference population animals with genotypic and phenotypic data. Statistical methods for prediction of EBV typically fall into three categories: BLUP models that use SNP markers to replace or augment pedigree data when building the matrix of relationships between animals, Bayesian regression models that assume the effects of SNP markers are sampled from some distribution or mixture of distributions, or machine learning algorithms that allow highly flexible modeling of the associations between SNP markers and the trait of interest.
BLUP methods
Perhaps the simplest method of estimating SNP effects is the so-called SNP-BLUP model (Meuwissen et al., 2001), in which one assumes that all of the SNP effects are sampled from a single normal distribution with common variance. The model is: y = Xβ + Zg + e, where y is a vector of phenotypes, X is an incidence matrix that maps phenotypes to management effects, β is a vector of fixed management effects, Z is a incidence matrix that maps phenotypes to SNP genotypes (typically with entries of 0, 1, or 2, corresponding to the number of copies of a given allele), g is a vector of random SNP effects, and e is a vector of random residuals, with E(g) ~ N(0,Iσg) and E(e) ~ N(0,Iσe), and where σg and σe are the SNP variances and error variances, respectively. The genomic EBV of a young selection candidate that lacks performance data can be predicted by multiplying the estimates in g by the number of copies of the corresponding SNP alleles and summing across the genome.
An equivalent method that is more familiar to most animal breeders is the so-called genomic BLUP (GBLUP) model (VanRaden et al., 2009). In this case, information about SNP genotypes is used to build the matrix of relationship between animals, instead of using pedigree data. The model is similar to the BLUP animal model described previously, and it can be described as: y = Xβ + Zu + e, where y is a vector of phenotypes, X is an incidence matrix that maps phenotypes to management effects, β is a vector of fixed management effects, Z is a incidence matrix that maps phenotypes to animal effects, u is a vector of random animal additive genetic effects, and e is a vector of random residuals, but now E(u) ~ N(0,Gσa), where G is a matrix of additive genetic relationships among animals built from rescaled SNP genotype data, E(e) ~ N(0,Iσe), and σg and σe are the additive genetic and residual variance components, respectively. As in conventional BLUP, additional animals without performance records can be included in the relationship matrix, G, such that their EBV can be predicted by solving for u. In this case, the most interesting animals are young male and female selection candidates with SNP genotypes, and their EBV are predicted based on genomic relationships with older animals in the reference population.
A major challenge with genomic selection is that not all animals in the population are genotyped. Therefore, in order to carry out genetic evaluations and make selection decisions for all animals of a given breed, one must compute genome-based predictions for genotyped animals and pedigree-based predictions for non-genotyped animals and then combine the results. An additional complication is that selection bias can occur if cows that have been genotyped were pre-selected based on pedigree or performance data, or if replacement heifers that were retained as lactating cows were pre-selected based on their genomic test results. Therefore, a method for predicting the EBV of selection candidates in a simultaneous analysis of pedigree and genomic data was needed. Legarra et al. (2009) and Misztal et al. (2009) solved this problem by proposing a method known as single-step GBLUP (ssGBLUP). In the ssGBLUP model, we again have: y = Xβ + Zu + e, where y is a vector of phenotypes, X is an incidence matrix that maps phenotypes to management effects, β is a vector of fixed management effects, Z is a incidence matrix that maps phenotypes to animal effects, u is a vector of random animal additive genetic effects, and e is a vector of random residuals, but now E(u) ~ N(0,Hσa), where H is a matrix of relationships that represents a weighted combination of the pedigree-based relationship matrix (A) and the genome-based relationship matrix (G), E(e) ~ N(0,Iσe), and σg and σe are the additive genetic and residual variance components, respectively. The challenge with ssGBLUP, particularly as the number of genotyped animals in the population continues to grow, is to obtain the matrix H-1 when solving for u. Legarra et al. (2014) developed an efficient method for computing H-1, and this approach was enhanced by development of the algorithm for proven and young animals (APY) by Misztal et al. (2014), which now allows application of ssGBLUP to very large populations of genotyped and non-genotyped animals.
Bayesian regression models
Bayesian regression methods address the problem of estimating SNP effects when the number of animals with phenotypes is less than the number of SNP markers, by treating markers or phased chromosomal segments (haplotypes) as random and incorporating a prior distribution for the variance components associated with SNP markers or haplotypes. These models are conceptually similar to SNP-BLUP and can be written as: y = Xβ + Zg + e, where y is a vector of phenotypes, X is an incidence matrix that maps phenotypes to management effects, β is a vector of fixed management effects, Z is a incidence matrix that maps phenotypes to SNP genotypes, g is a vector of random SNP effects, and e is a vector of random residuals, with E(e) ~ N(0,Iσe). However, now one assumes E(g) ~ N(0,Vg), where Vg is a diagonal matrix with elements σgi, which allows a different variance component for each SNP marker. The difference among these Bayesian regression methods lies in the assumption about the prior distribution from which the marker variances, σgi, are sampled.
Meuwissen et al. (2001) originally proposed the Bayes A method, which assumes a Student’s t-distribution with thick tails as the prior distribution. The purpose of a thick-tailed distribution is to allow a few SNPs to have large effects on the trait of interest, presumably those that are in strong LD with a nearby QTL, while the remaining SNPs are assumed to have little or no effect on the animal’s phenotype. The Bayes B method (Meuwissen et al., 2001) carries this concept a bit further, by postulating that SNP effects follow a mixture of two distributions. A proportion (π) of the SNP markers are assumed to have an effect of zero, whereas a Student’s t-distribution is used as a prior for the variance components of the remaining proportion (1-π) of SNP markers. Habier et al. (2011) extended the Bayesian alphabet by proposing the Bayes Cπ method, in which π of the SNP markers are assumed to have an effect of zero, and a normal prior distribution is assumed for the variances pertaining to the remaining (1-π) markers; in this case, the mixture parameter, π, can be estimated from the data rather than assumed known. Other methods have been used in animal breeding as well, such as the Bayesian LASSO (de los Campos et al., 2009), in which a double exponential prior distribution is assumed. More recently, Erbe (2012) proposed the Bayes R method, which postulates a mixture of normal prior distributions and more effectively accommodates SNPs with zero, small, medium, and large effects. The aforementioned Bayesian regression methods tend to outperform GBLUP slightly in applications in which one or more QTL with moderate or large effects exist, but GBLUP performs as well or better than Bayesian regression models when inheritance approaches the infinitesimal model; that is, when the trait is affected by many genes, each with a very small effect.
Machine learning algorithms
Machine learning is a branch of artificial intelligence in which the objective is to predict the outcome of an event for an individual that has not been observed (unlabeled data), using knowledge about the relationships between some known attributes (or features) and the outcomes that have been observed in another group of individuals (labeled data). Machine learning methods are highly flexible and very powerful, and they can discover hidden patterns in large, messy data sets with hundreds or thousands of potential explanatory variables, some of which may be missing for certain individuals. Long et al. (2007) applied machine learning to genomic prediction, using SNP genotypes to classify broiler chickens for mortality traits. Later, Yao et al. (2013) showed the flexibility of machine learning methods, by using a random forest algorithm to identify potentially additive and epistatic QTL affecting residual feed intake in dairy cattle. More recently, Ehret et al. (2015) used an artificial neural network to predict the milk yield EBV of Holstein-Friesian and Fleckvieh sires in Germany.
While machine learning algorithms are powerful and capable of providing very accurate predictions of future outcomes, they are “black box” in nature, and caution must be used to ensure that results are repeatable in independent data sets. The performance of such methods is usually assessed using cross-validation, in which a random testing set (e.g., 20% of the data) is set aside, and predictions for these individuals are derived from the remaining training set (e.g., 80% of the data). The predicted outcomes or phenotypes for individuals in the testing set are compared with actual values of the same individuals to evaluate prediction accuracy, and this process is repeated numerous times to obtain predictive correlations and their standard errors. A common challenge is overfitting the data points in the training set, and this can lead to poor predictive performance in independent data sets. Nonetheless, it is likely that advanced machine learning methods, such as deep neural networks, will play an important role in genome-based prediction in the future.
Impact of Genomic Selection on Genetic Progress
Generation interval
García-Ruiz et al. (2016) documented tremendous changes in generation interval (GI) in the U.S. Holstein population since the introduction of genomic selection, as shown in Figure 1.

For the sires of bulls pathway, average GI decreased from nearly 7.5 years to less than 2.5 years, while a reduction from 7 years to less than 5 years was observed in the sires of cows pathway. The downward trend in GI for dams of bulls accelerated when genomic selection was implemented, such that bull dams are now 2.5 years old, on average, when their sons are born. An additional reduction in average GI for the sires of cows pathway is likely, given that young genome-tested bulls now account for approximately 70% of inseminations on commercial farms. Slight decreases will also be achieved in the sires of bulls and dams of bulls pathways through earlier collection of semen from elite young bulls and earlier use of IVF in elite young heifers.
Genetic gain per year
These dramatic decreases in GI have had a profound effect on the rate of genetic progress, as shown by García-Ruiz et al. (2016) in Figure 2.

As shown above, the predicted rate of progress for protein yield in U.S. Holsteins has more than doubled since the introduction of genomic selection in 2009, as has the observed rate of genetic gain in herdbook-registered Holstein cows. A smaller increase in genetic trend was observed in the overall Holstein cow population, because it lags the trend in AI sires and elite cows by one generation.
Selection differentials
García-Ruiz et al. (2016) also computed the relative contributions of each of the four paths of selection to the overall selection differential for protein yield in U.S. Holsteins, as shown in Figure 3.

As shown above, the sires of bulls pathway is responsible for about 50% of the genetic progress in protein yield, whereas the dams of bulls pathway accounts for approximately 30%, and the sires of cows pathway accounts for roughly 20%. Progress due to selection of dams of cows, which occurs from on-farm culling decisions, has been negligible. This demonstrates the key role of sire analysts at AI companies in driving genetic progress, and changes in the relative proportions since the introduction of genomic selection largely mirror the changes in generation interval shown in Figure 1.
On-farm sire selection decisions
Farmers can benefit from genomics technology without testing their calves, heifers, or cows, simply by purchasing the semen of young, genome-tested bulls. These bulls are genetically far superior to older, progeny-tested bulls. For example, in the April 2017 Council on Dairy Cattle Breeding (Bowie, MD) genetic evaluation of U.S. dairy cattle, there were 2242 young genome-tested Holstein bulls with semen available, and they averaged +1125 pounds of PTA milk, +59 pounds of PTA fat, +43 pounds of PTA protein, and +$643 Lifetime Net Merit relative to the average U.S. Holstein cow. At the same time, there were 556 older progeny-tested Holstein bulls with semen available, and their averages were +717, +33, +26, and +$374, respectively. The average difference of $274 in expected lifetime net profit per cow between daughters of young genome- tested bulls and daughters of older progeny-tested bulls is why most U.S. dairy farmers have switched to using primarily genome-tested bulls in their herds. The REL values associated with genomic predictions for young bulls are slightly lower than those of progeny-tested bulls, but farmers can easily manage the risk of lower REL by using semen from a larger group of bulls. We typically recommend that farmers purchase semen from two to three times as many different bulls when switching to young genome-tested bulls, as compared with the number of older progeny-tested bulls they used at any given time.
Inbreeding and inherited defects
Inbreeding is a natural consequence of selection, and selection intensity is a key contributor to both genetic progress and inbreeding. Selection intensity is high when relatively few genetically superior animals provide a large proportion of the genetics represented in the next generation, through use of AI, ET, and IVF technologies. The goal is not to reduce or eliminate inbreeding in a population, but rather to manage the rate of change in inbreeding, and to mitigate its impact by identifying genes that negatively impact health or performance when the unfavorable allele is inherited from both parents. VanRaden et al. (2011) showed how the absence of homozygous animals for certain haplotypes (haploid segments of DNA) that are common among heterozygotes in the population can be used to identify inherited defects using SNP data. It is relatively simple to incorporate information about these undesirable haplotypes, as well as other known genetic defects, into a computerized mating program that will prevent the matching of specific bulls and cows that carry the same undesirable recessives.
Overall, increases in average genetic relationships within a population over time are still a concern, as regards maintenance of genetic diversity. Because genomic selection leads to more rapid genetic progress, through increased selection accuracy and decreased generation interval, relationships within the population tend to accumulate more rapidly. On other hand, genomic EBVs allow selection among male and female full-siblings that share identical pedigrees and, therefore, equivalent PA values. Before genomics all full brothers resulting from an ET or IVF mating of an elite bull and cow would be purchased by competing AI studs. After genomics, however, the bull calf with the highest genomic EBV will be purchased by the AI stud with first choice, and the remaining AI studs will move on to other families in their search for genetically superior young bulls, thereby increasing genetic diversity in the next generation.
Selection for Novel Traits
Feed efficiency
Genetic selection for higher milk production has increased the overall efficiency of energy utilization in modern dairy cattle, but differences between families in the ability to digest nutrients more effectively or build and break down body tissues more efficiently have not been exploited in genetic improvement programs. Recent studies, such as Yao et al. (2013), have shown that it is possible to improve feed efficiency through selection for residual feed intake (RFI), a measure of the amount of excess feed energy a cow consumes each day relative to her energy requirement, where the latter is computed from her milk yield, milk composition, metabolic body weight, and change in body weight (or body condition score). Low RFI values are desirable, and when coupled with selection for moderate body size this trait can have a significant impact on feed costs and farm profitability. In addition, correlated responses in the amount of feed consumed by growing heifers during the rearing period can further enhance farm profitability.
The key to improving feed efficiency, or any other trait that is difficult and/or expensive to measure on commercial farms, is to establish a deeply phenotyped reference population of animals with detailed performance data and genomic testing data. Information from this population can be used to estimate SNP effects (with SNP-BLUP, Bayesian regression, or machine learning) or build a genomic relationship matrix (with GBLUP or ssGBLUP) from which one can compute genomic EBVs for hundreds of thousands of male and female selection candidates throughout the population that have genomic data only. Optimal size of the reference population varies, depending on heritability of the trait, but in most situations at least 5000 animals are needed for preliminary selection decisions, and upwards of 20,000 to 30,000 are needed to permit high REL and ensure rapid genetic progress for the trait of interest. Another key consideration is the degree of relationships between the older animals in the reference population and the new selection candidates, because closer relationships will lead to more accurate genomic EBV and more effective selection decisions.
Animal health
Improvements in the milk production and physical conformation of dairy cattle due to genetic selection have been impressive, but in the past two decades the focus has shifted to improving fertility, udder health, longevity, and calving ability. Recently, direct selection for improved animal health has been a key objective. Vukasinovic et al. (2016) described how phenotypes for common early and mid-lactation health disorders, including ketosis, metritis, retained placenta, displaced abomasum, mastitis, and lameness can be recovered from on-farm herd management software for use in genetic selection programs. The ssGBLUP method was used to compute genomic EBVs for Holstein bulls, cows, heifers, and calves, and the results were combined with existing production, fertility, calving ability, and longevity data to provide farmers with an index of dairy cow wellness and lifetime profitability.
Environmental tolerance
The contributions of livestock to global greenhouse gas emissions have been well-documented, but opportunities exist for reducing enteric methane emissions through genetic selection, either by improvement of feed efficiency or direct selection for methane-related traits. A key consideration as regards climate change is environmental adaptation, where the objective is to breed animals that are more robust to changes in the temperature-humidity index (THI) or other environmental conditions. Garner et al. (2016) built upon previous work (e.g., Ravagnolo et al., 2000) when showing that genomic data could be used to identify cows that are less susceptible to the effects of heat stress. Differences exist between families in the point of onset (THI value) at which heat stress begins to impair health, fertility, and performance, as well as the rate of decline in these phenotypes per each additional unit of THI beyond the point of onset. Similar methodology could be used to model differences between animals in response to other environmental or management challenges, such as increasing level of exposure to a pathogen or parasite, or decreasing level of dietary protein in the ration.
Opportunities for Genome-guided Dairy Herd Management
Early culling of inferior replacement heifers
The greatest use of genomic testing on large commercial dairy farms has been in sorting potential replacement heifers at a young age for the purpose of reducing feed costs during the rearing period, because many farmers have an excess of heifer calves due to low replacement rates and/or the use of gender-enhanced semen. Genomic EBVs can be used to select among young heifer calves, so that farmers can sell their genetically inferior calves and keep only those calves that are likely to make a positive contribution to farm profitability when they become lactating cows (Weigel et al., 2012). Our ability to sort calves effectively based on early genomic predictions is demonstrated in Figure 4.

As shown above, the calves with the highest genomic EBVs for milk yield produced an extra 5000 pounds of milk when they reached first lactation, as compared with the group of calves with the lowest genomic EBVs. Many farmers throughout the United States have adopted genomic testing for early culling decisions, because the $40 to 50 cost of testing a calf is far less than the feed cost associated with raising a heifer that is likely to be culled during first lactation. Farmers typically cull the bottom 15 to 20% of calves, but the exact proportion depends on the number of surplus heifer calves available on a given farm.
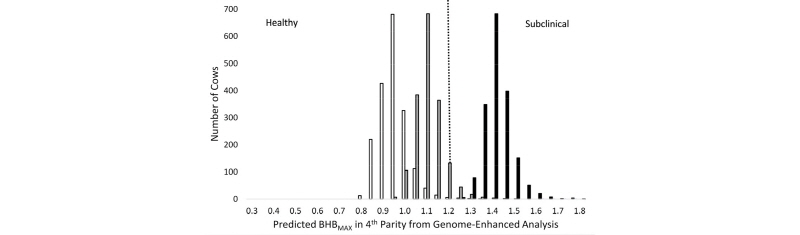
Identification of animals with high disease risk
Calculation of whole genome risk scores for common diseases is an active area of research in human medicine, and it has potential applications in livestock as well. Genome-guided management of dairy cattle is still in its infancy, and more research is needed in order to identify situations in which the cost of prophylactic treatment or some other type of management intervention for high-risk animals can offset the cost of routine genomic testing. In a recent paper, Weigel et al. (2017) computed whole genome risk for hyperketonemia, a disease more commonly as clinical or subclinical ketosis. Predicted phenotypes for blood concentration of β-hydroxybutyrate (BHB) were calculated from the estimated effects of contemporary group, lactation number, and animal EBV, where the latter were computed using ssGBLUP methodology, as shown in Figure 5.
As shown in Figure 5, herd management has a large effect on the risk of hyperketonemia, but within a population of cows with similar age, management practices, and environmental conditions, one can differentiate among cows with low, average, or high risk of disease using SNP markers. Overall, approximately 70% of cows could be classified correctly as healthy or hyperketonemic, using a blood BHB threshold of 1.2 mmol/L. A similar approach could be used to detect animals that are at risk for other common and costly health disorders, such as mastitis, hypocalcemia, lameness, or calfhood pneumonia.
Assessment of herd management practices
An overlooked opportunity, as regards the application of genomic data on commercial dairy farms, is the opportunity to evaluate the efficacy of farm management practices by measuring the extent to which a farmer is able to realize the benefits of genetically superior cattle. We know, for example, that a difference of 1.0 pounds in EBV for milk yield between a given cow and one of her herdmates should lead to a realized difference of 1.0 pounds of actual milk yield per lactation. However, research has shown that cows in low-input rotational grazing herds with little or no supplemental concentrate will produce only 0.7 or 0.8 pounds of extra milk per pound of EBV, whereas cows in high-input herds with exceptional nutrition and management often produce 1.4 or 1.5 pounds of extra milk per pound of EBV. Therefore, a scatter plot of the relationship between cows’ genomic EBVs and their actual phenotypes for milk yield or other traits can provide an assessment of whether the herd’s management practices allow the cows to achieve their full genetic potential, as shown in Figure 6.
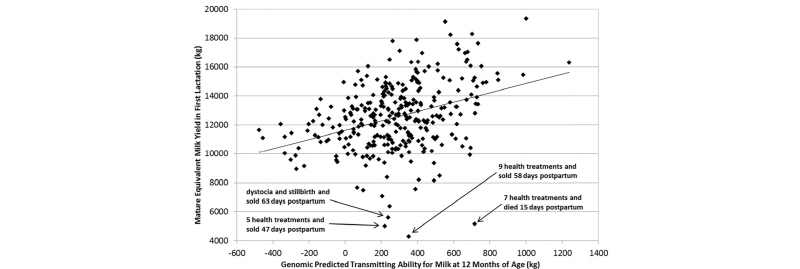
As shown above, cows with dystocia and other early postpartum health problems are unable to reach their genetic potential for milk yield and often succumb to early culling from the herd. Diagnostic tools of this type could be useful to veterinarians, nutritionists, reproduction specialists, and herd managers to account for genetic variation between cows when trouble- shooting herd management practices.
Summary
In summary, genomic selection has revolutionized dairy cattle improvement programs in the United States and other leading dairy countries (Wiggans et al., 2017). Genetic progress has accelerated markedly, due to large decreases in generation interval and large improvements in the accuracy of EBVs for lactating cows and young bulls and heifers. Pedigree breeders and AI studs were early adopters of this technology, because the cost of genomic testing was small relative to the value of their breeding stock. Adoption by commercial dairy farms whose main interest is selling milk came more slowly, but advances in genotype imputation provided low-cost genotyping arrays that have led to the testing of 30,000 to 40,000 calves per month. Dairy farmers can improve profitability very quickly by purchasing semen of young genome-tested bulls, because their genetic merit is much greater than that of progeny-tested bulls available at the same time. They can also reduce feed costs through early culling of genetically inferior heifer calves that are unlikely to be suitable as future herd replacements. Additional value can be gained from using genomic data to manage inbreeding, and by using computerized mate selection programs to reduce the incidence of inherited defects. Future advancements will come from genetic selection for novel traits that are too difficult and expensive to measure in conventional progeny testing programs, as well as development of decision tools for genome-guided management of animal health and performance.
