Seulgy Lee  1 , Chang Gwan Dang 1 , Jihwan Lee 1 , Gyeonglim Ryu 1 , Eun Ho Kim 2 , Jae Hyuk Jang 3 , Da Jeong Lim 3* , Tae Jeong Choi 2*
1Dairy Science Division, National Institute of Animal Science, Cheonan 31000, Republic of Korea
2Animal Genetics & Breeding Division, National Institute of Animal Science, Cheonan 31000, Republic of Korea
3Department of Animal and Dairy Sciences, College of Agriculture and Life Sciences, Chungnam National University, Daejeon 34134, Republic of
Korea
*Corresponding author: limdj@cnu.ac.kr, choi6695@korea.kr
Volume 10, Number 3, Pages 163–172, September 2026.
Journal of Animal Breeding and Genomics 2026, 10(3), 163–172. https://doi.org/10.12972/jabng.2026.10.3.6
Received on August 12, 2026, Revised on September 29, 2026, Accepted on September 29, 2026, Published on September 30, 2026.
Copyright © 2026 Korean Society of Animal Breeding and Genetics.
This is an Open Access article distributed under the terms of the Creative Commons Attribution Non-Commercial License (https://creativecommons.org/licenses/by-nc/4.0/) which permits unrestricted non-commercial use, distribution, and reproduction in any medium, provided the original work is properly cited.

fixation index (FST), Hanwoo, Holstein, Jersey, principal component analysis (PCA)
Holstein cattle are the predominant dairy breed worldwide and are characterized by their high milk yield, whereas Jersey cattle are well known for their superior milk fat percentage and total solids content. In contrast, Korean native cattle (Hanwoo) are an indigenous Korean breed that has been selectively bred for beef production. Although Hanwoo are genetically distinct from European dairy breeds such as Holstein and Jersey, Holstein and Jersey also exhibit breed-specific genetic differentiation despite their shared dairy production purpose. Therefore, informative genetic markers are needed to distinguish among Hanwoo, Holstein, and Jersey cattle, including the differentiation between the two dairy breeds. These genetic differences among breeds provide an important basis for evaluating population differentiation and breed identification.
In Korea, Holstein cattle have long been the predominant dairy breed, while Jersey cattle have been increasingly introduced and utilized as an alternative dairy breed. The domestic Jersey population has been gradually expanding, with more than 800 Jersey cattle reported in Korea in 2024. To further establish a domestic Jersey breeding base, the National Institute of Animal Science (NIAS) initiated a genomic evaluation program in September 2025, collecting tissue samples from Jersey calves on a quarterly basis from participating farms. The collected samples are being used for genomic analysis and genetic evaluation to support the identification and utilization of genetically superior animals. In addition, Holstein–Jersey crossbreeding has been conducted in Korea, resulting in animals with varying proportions of Holstein and Jersey ancestry. These changes in the domestic Jersey population and the increasing use of genomic information highlight the need for accurate identification of Holstein, Jersey, and crossbred animals, particularly for breed registration, pedigree management, and genetic resource conservation.
In recent years, increasing attention has been directed toward the conservation of livestock genetic resources and the accurate characterization of breed identity, leading to extensive population genetic studies using high-density single nucleotide polymorphism (SNP) data. Among the various measures of genetic differentiation, the fixation index (FST) is one of the most widely used statistics for quantifying genetic divergence between populations based on differences in allele frequencies. FST reflects the relationship between the expected heterozygosity of the total population and the heterozygosity within subpopulations, thereby providing a quantitative measure of genetic differentiation. The value of FST ranges from 0 to 1, where values close to 0 indicate little genetic differentiation and values approaching 1 indicate strong genetic divergence between populations.
Population genetic analyses based on high-density SNP data have become essential tools for breed discrimination and the characterization of genetic structure in livestock populations. In particular, FST has been widely applied to identify informative markers that effectively distinguish breeds (Weir and Cockerham, 1984). Gautier et al. (2010) analyzed genome-wide SNP data from 47 cattle breeds worldwide and reported significant levels of genetic differentiation among breeds, demonstrating the effectiveness of FST for detecting population structure. Similarly, Decker et al. (2014) investigated the population structure of 134 cattle breeds and identified distinct genetic clusters corresponding to geographic origin and breed, with principal component analysis (PCA) clearly separating the different breed groups.
In Korea, major cattle breeds, including Hanwoo, Holstein, and Jersey, have been developed for different breeding objectives and possess distinct genetic backgrounds. However, objective molecular criteria for accurately discriminating these breeds remain insufficiently established. Conventional breed identification has largely relied on phenotypic characteristics and pedigree records, which do not adequately reflect underlying genetic variation. Consequently, there is an increasing demand for objective and quantitative molecular markers to support breed identification, genetic resource conservation, breed registration, and breeding program development.
Therefore, the objectives of this study were to quantify genetic differentiation between Holstein and Jersey cattle using high-density SNP genotypes and FST, and to identify informative SNP markers capable of discriminating among Hanwoo, Holstein, and Jersey cattle. Furthermore, the performance of the selected SNP markers was evaluated to provide a scientific basis for breed identification, pedigree management, and the conservation of bovine genetic resources.
A total of 3,643 cattle representing three breeds raised in Korea were included in this study: 1,094 Hanwoo (Korean native cattle), 1,919 Holstein, and 630 Jersey cattle. All animals were genotyped using the Illumina BovineSNP50 v3 BeadChip. Quality control (QC) was performed on the genotype data to ensure the reliability of the analyses. SNPs with a genotype missingness rate greater than 10% (–geno 0.1) and individuals with an individual missingness rate greater than 10% (–mind 0.1) were excluded from the analysis. In addition, SNPs with a minor allele frequency (MAF) below 0.01 (–maf 0.01) or those deviating significantly from Hardy–Weinberg equilibrium (HWE; p < 1 × 10⁻⁶; –hwe 0.000001) were removed. These QC procedures were based on standard criteria commonly applied in large-scale population genetic studies (Anderson et al., 2010; Marees et al., 2018). These breeds differ in their genetic backgrounds and breeding objectives, making them suitable populations for evaluating genetic differentiation among breeds. All animal procedures were conducted under approval of the National Institute of Animal Science Animal Care and Ethics Committee, Republic of Korea (approval no. NIAS-058).
Genetic differentiation between Holstein and Jersey cattle was quantified using FST. Pairwise SNP-specific FST values between Holstein and Jersey cattle were calculated using the Weir and Cockerham method implemented in PLINK v1.9 (Purcell et al., 2007). SNPs with undefined FST values were excluded from subsequent analyses, and only SNPs with valid FST estimates were retained. The Holstein and Jersey populations were used for FST-based SNP selection, whereas Hanwoo cattle were subsequently included in PCA to evaluate whether the selected SNP markers could discriminate among the three breeds.
Candidate breed-discriminating SNPs were selected according to their FST values, with higher FST values indicating greater differences in allele frequencies between Holstein and Jersey cattle. These highly differentiated SNPs were considered potential markers for breed discrimination. A total of 47,450 SNPs were analyzed. Among these, 51 SNPs with FST ≥ 0.85 were selected as candidate markers, and a subset of 10 SNPs with FST ≥ 0.90 was further evaluated as a highly informative marker panel.
PCA was performed to evaluate the discriminatory power of the selected FST-based SNP markers by reducing the dimensionality of the genotype data and summarizing the major sources of genetic variation. PCA was conducted using the –pca option in PLINK v1.9 (Purcell et al., 2007), which calculates the genetic covariance matrix among individuals and extracts principal components through eigenvalue decomposition.
Only the selected high-FST SNP markers were included in the analysis. The first principal component (PC1) and the second principal component (PC2) were visualized to assess whether the selected SNP markers could effectively discriminate among Hanwoo, Holstein, and Jersey cattle.
To identify SNP markers showing high genetic differentiation between Holstein and Jersey cattle, pairwise FST values were calculated, and the results are presented in Table 1.
FST is a representative statistic for evaluating the level of genetic differentiation based on differences in allele frequencies among populations. In this study, SNP-specific FST values were calculated using the weighted estimator proposed by Weir and Cockerham (1984), as implemented in PLINK v1.9 (Purcell et al., 2007). This method is known to provide a more conservative and reliable estimate of genetic differentiation by accounting for unequal sample sizes and missing genotypes (Weir and Cockerham, 1984; Purcell et al., 2007).
Table 1. Breed-discriminating SNPs with FST values ≥ 0.90
| CHR | SNP | POS | N | FST |
|---|---|---|---|---|
| 14 | BTB-00557585 | 24607527 | 2548 | 0.997638 |
| 20 | Hapmap51736-BTA-50602 | 41777888 | 2549 | 0.985802 |
| 4 | ARS-BFGL-NGS-116590 | 77635835 | 2549 | 0.979797 |
| 2 | ARS-BFGL-BAC-5705 | 103707675 | 2549 | 0.961555 |
| 4 | ARS-BFGL-NGS-16805 | 77150031 | 2549 | 0.947789 |
| 26 | Hapmap24165-BTA-60897 | 22587068 | 2521 | 0.938966 |
| 20 | Hapmap51735-BTA-50264 | 35334580 | 2534 | 0.938222 |
| 4 | BTB-02085810 | 90847252 | 2549 | 0.916129 |
| 4 | Hapmap50622-BTA-21349 | 90820722 | 2548 | 0.916099 |
| 7 | BTB-01153707 | 28897553 | 2548 | 0.903334 |
| CHR: chromosome number; SNP: single nucleotide polymorphism; POS: physical position (bp); N: number of individuals | ||||
| with non-missing genotypes used for FST estimation; FST: fixation index. | ||||
Pairwise FST analysis was performed using genotype data from 2,549 animals, comprising 1,919 Holstein and 630 Jersey cattle. For each SNP, N represents the number of individuals with non-missing genotype information used for the corresponding FST estimate. Hanwoo cattle were not included in the FST calculation but were included in the subsequent PCA using the selected SNP markers. The SNP-specific FST values showed a wide distribution, ranging from low to relatively high values (Figure 1). Using a threshold of FST ≥ 0.85, a total of 51 SNPs were selected, although the complete list is not presented. Using a more stringent threshold of FST ≥ 0.90, 10 SNPs were finally identified as breed- discriminating markers. The thresholds of FST ≥ 0.85 and FST ≥ 0.90 were selected as stringent criteria for identifying SNPs with particularly large allele-frequency differences between Holstein and Jersey. The FST ≥ 0.85 threshold yielded a broader set of highly differentiated candidate markers, whereas the more stringent FST ≥ 0.90 threshold was used to identify a compact set of highly informative markers for PCA-based evaluation. Thus, these thresholds were applied as marker-selection criteria rather than as general classifications of the magnitude of population differentiation. Undefined FST values were observed for some SNPs, which were considered to result from insufficient genetic variation among populations or limited valid genotype information at those loci. These loci were excluded from subsequent analyses so that only SNPs with reliable signals of genetic differentiation among breeds were retained. This procedure has been commonly applied in previous population genomic studies (Akey et al., 2002).
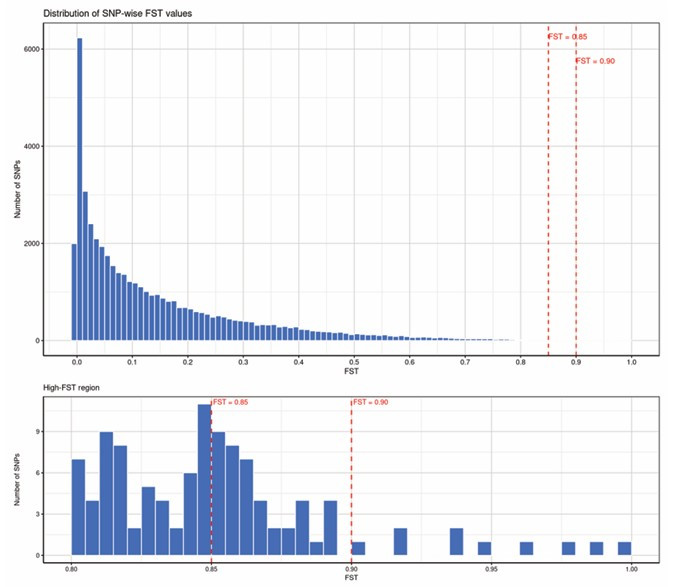
Figure 1. Distribution of SNP-wise FST values between Holstein and Jersey populations. The upper panel shows the distribution of FST values across all SNPs, and the lower panel shows an expanded view of the high-FST region (FST ≥ 0.80). Red dashed lines indicate the FST thresholds of 0.85 and 0.90 used for SNP selection.
The SNPs with high FST values exhibited large differences in allele frequencies between Holstein and Jersey cattle. These highly differentiated SNPs were subsequently used for PCA including Hanwoo, Holstein, and Jersey cattle to evaluate whether the selected markers could discriminate among the three breeds. The PCA results indicated that these markers also reflected the genetic distinction between Hanwoo and the two European dairy breeds, although the FST values themselves were calculated only between Holstein and Jersey. Similar patterns of differentiation among continental lineages and cattle breeds have been reported in previous genomic studies (McTavish et al., 2013; Decker et al., 2014).
Moderate to high FST values observed between Holstein and Jersey indicate substantial allele-frequency differentiation between the two dairy breeds despite their shared dairy production purpose. This finding suggests that the two breeds have accumulated distinct genetic differences through long-term breed differentiation and selection despite their common dairy purpose. These results are consistent with previous studies reporting that genetic differentiation among dairy breeds is distributed across the genome rather than being confined to specific genomic regions (Makina et al., 2015).
In this study, SNPs with FST ≥ 0.85 were defined as highly differentiated markers. According to Wright (1978), FST values of 0–0.05, 0.05–0.15, 0.15–0.25, and >0.25 indicate little, moderate, great, and very great genetic differentiation, respectively. In this study, the thresholds of FST ≥ 0.85 and FST ≥ 0.90 were used as stringent marker-selection criteria to identify SNPs showing particularly large allele-frequency differences between Holstein and Jersey cattle. Recent studies have also reported that breed discrimination can be achieved using only several dozen SNP markers (Strucken et al., 2021).
The genome-wide distribution of SNP-specific FST values across the Holstein and Jersey populations is shown in Figure 2. The SNPs with FST values exceeding the selection thresholds of 0.85 and 0.90 were distributed across multiple chromosomes rather than being restricted to a single genomic region. This finding suggests that the genetic differentiation identified in this study reflects genome-wide differences accumulated through long-term breed differentiation and breeding rather than differentiation restricted to specific selected loci. These results support the effectiveness of the FST-based approach for identifying breed-discriminating SNP markers.
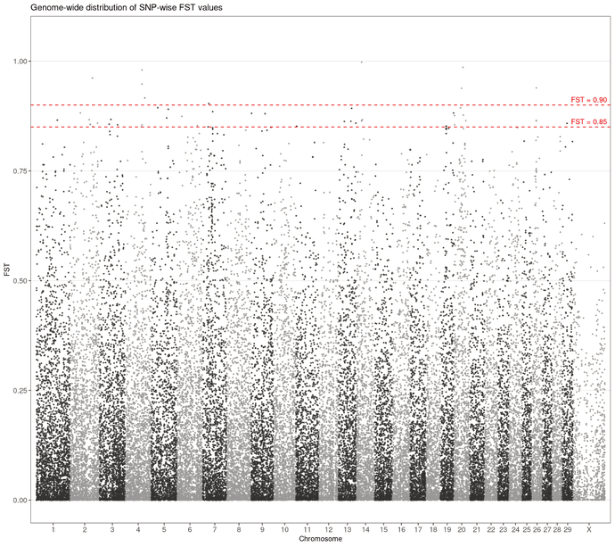
Figure 2. Genome-wide distribution of SNP-wise FST values between Holstein and Jersey populations. Red dashed lines indicate the FST thresholds of 0.85 and 0.90 used for SNP selection.
PCA was performed to evaluate the breed-discriminating ability of the SNP markers selected by the FST analysis. PCA is a representative method for visualizing the genetic structure among populations by reducing high-dimensional genomic data into a lower-dimensional space and has the advantage of effectively summarizing the major axes of genetic variation among individuals (Jolliffe, 2002; Patterson et al., 2006). In this study, PCA was performed using both the complete SNP dataset and the FST-selected SNP markers, and the patterns of breed separation were compared.
The PCA results based on the complete SNP dataset are presented in Figure 3. Using the complete SNP dataset, clear differences in genetic structure were observed among Hanwoo, Holstein, and Jersey cattle, and the three breeds formed distinct, non-overlapping clusters. This result suggests that genetic differentiation among breeds is reflected across the entire genome rather than being restricted to specific genomic regions.
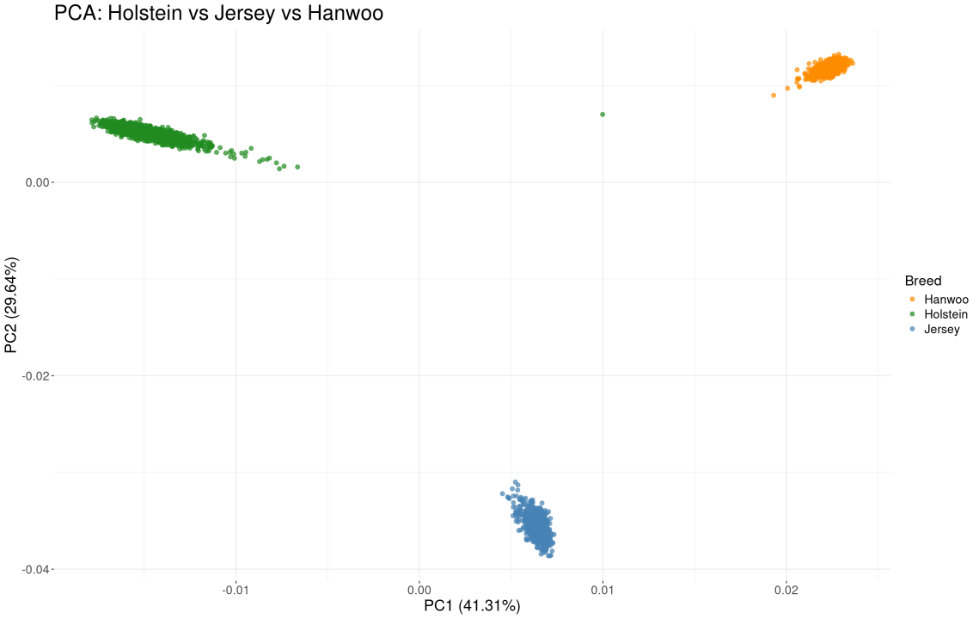
Figure 3. Principal component analysis of Hanwoo, Holstein, and Jersey populations based on the complete SNP dataset.
The PCA results based on the SNPs selected using the FST ≥ 0.90 threshold are presented in Figure 4. The first principal component (PC1) explained 75% of the total genetic variation, whereas the second principal component (PC2) explained 11%. The PCA based on the FST ≥ 0.90 SNPs showed that PC1 primarily differentiated Holstein and Jersey, whereas PC2 primarily separated Hanwoo from the two dairy breeds. These results indicate that SNPs with very high FST values strongly reflect differences in allele frequencies among breeds and effectively summarize breed separation along the major axes of genetic variation. However, compared with the PCA based on the complete SNP dataset, a slightly greater within-cluster dispersion was observed.
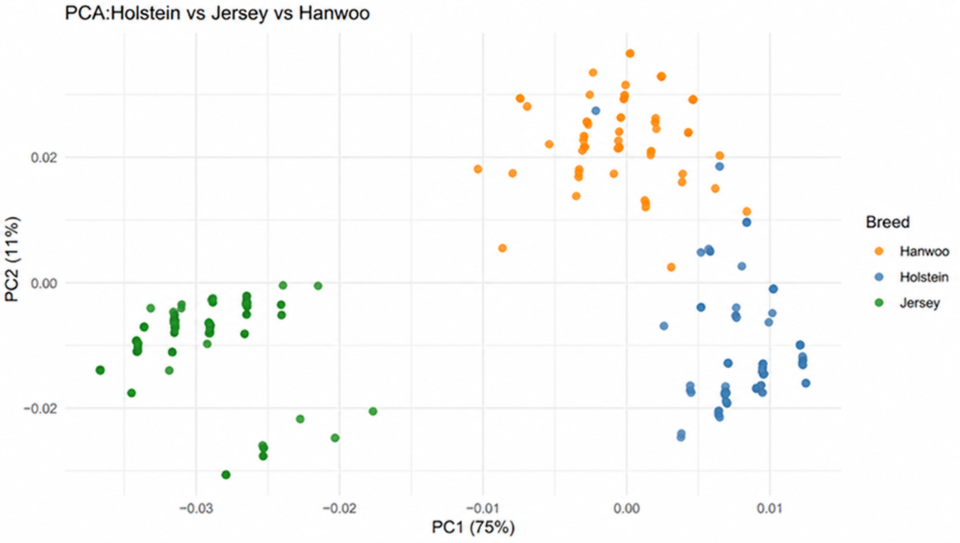
Figure 4. Principal component analysis of Hanwoo, Holstein, and Jersey populations based on SNPs with FST ≥ 0.90.
The PCA results based on the SNPs selected using the FST ≥ 0.85 threshold are presented in Figure 5. PC1 explained 75% of the total variation, whereas PC2 explained 9%. Compared with the FST ≥ 0.90 threshold, the proportion of variation explained by PC1 remained similar, whereas that explained by PC2 was slightly reduced. Nevertheless, the three breeds still formed clearly separated clusters in the PC1–PC2 space, and the within-cluster dispersion was relatively lower than that observed with the FST ≥ 0.90 marker set. This result is interpreted as reflecting a more stable representation of genetic variation among individuals through the inclusion of a larger number of SNP markers.
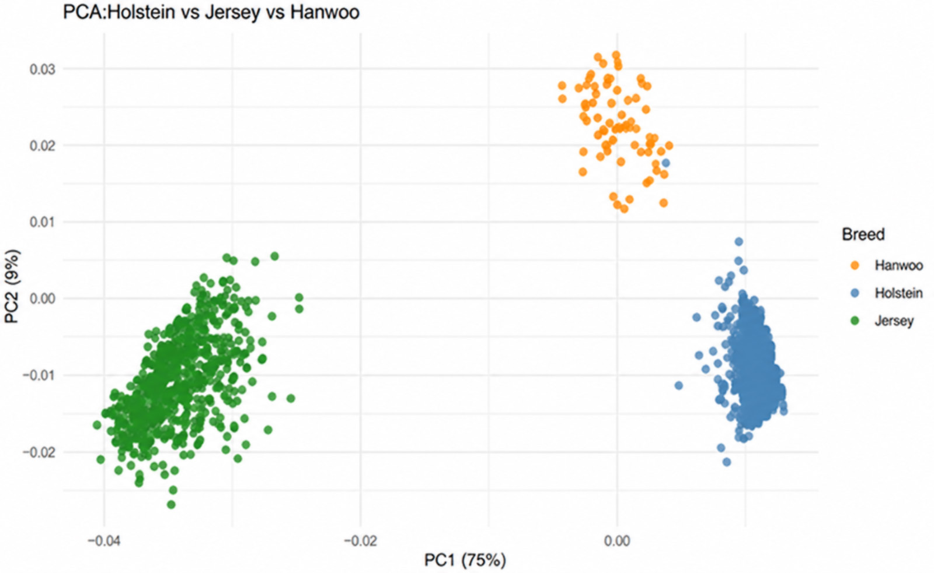
Figure 5. Principal component analysis of Hanwoo, Holstein, and Jersey populations based on SNPs with FST ≥ 0.85.
Comparison of the three PCAs showed that the complete SNP dataset provided the highest degree of breed separation, which is considered to result from the use of the maximum amount of genetic information. In contrast, PCA based on the FST-selected SNP markers successfully reproduced the major genetic structure among breeds using a relatively small number of SNPs. In particular, the FST ≥ 0.90 marker set showed clear breed separation in PCA using only 10 SNPs, indicating the potential feasibility of a minimal marker panel. Meanwhile, the FST ≥ 0.85 marker set, consisting of 51 SNPs, achieved clear breed separation with relatively stable clustering, although a small degree of overlap was observed for some individuals.
Overall, although the complete SNP dataset provided the highest discriminatory performance, its practical application may be limited in terms of computational efficiency and practicality. The FST ≥ 0.90 threshold provided clear visual separation using a minimal marker panel, whereas the FST ≥ 0.85 threshold provided relatively stable clustering while requiring a larger number of SNPs. Therefore, the FST ≥ 0.85 threshold may provide a practical compromise between marker number and clustering stability in the present dataset. These findings are consistent with previous studies emphasizing the importance of SNP selection criteria for stable PCA-based population structure analysis (McTavish et al., 2013; Decker et al., 2014).
In this study, genetic differentiation between Holstein and Jersey cattle was quantified using high-density SNP data and FST. Informative SNP markers were identified for subsequent evaluation of genetic structure among Hanwoo, Holstein, and Jersey cattle using PCA. PCA using the selected FST-based SNP markers generally showed clear genetic separation among Hanwoo, Holstein, and Jersey cattle under the evaluated FST thresholds, although a small degree of overlap was observed for some individuals. These findings suggest that the FST-based approach can identify informative SNP markers for evaluating genetic differences among cattle breeds and may serve as a useful resource for future studies on breed identification and the management of bovine genetic resources.
Not applicable.
Conceptualization: Lee S, Lim DJ, Choi TJ. Data curation: Lee S, Dang CG, Lee J, Ryu G. Formal analysis: Lee S, Kim EH, Jang JH. Methodology: Lee S, Kim EH, Lim DJ. Writing – original draft: Lee S. Writing – review & editing: Dang CG, Lee J, Ryu G, Kim EH, Jang JH, Lim DJ, Choi TJ. Supervision: Lim DJ, Choi TJ. Funding acquisition: Choi TJ. All authors read and approved the final manuscript.
No potential conflict of interest relevant to this article is reported.
All animal procedures, including the collection of tissue samples for genotyping, were reviewed and approved by the Institutional Animal Care and Use Committee of the National Institute of Animal Science, Rural Development Administration, Republic of Korea (approval no. NIAS-058).
This study was supported by the 2026 Collaborative Research Program between the University and the Rural Development Administration, Republic of Korea. Additional support was provided by the National Institute of Animal Science, Rural Development Administration, Republic of Korea (Project No. PJ01681301).
During the preparation of this manuscript, generative AI and AI-assisted technologies were used for language editing, grammatical correction, and improvement of clarity and readability. These technologies were not used to generate or analyze the research data, perform statistical analyses, interpret the results, or make scientific conclusions. The authors reviewed and verified all AI-assisted content and take full responsibility for the accuracy, integrity, and originality of the manuscript.
Akey JM, Zhang G, Zhang K, et al. 2002. Interrogating a high-density SNP map for signatures of natural selection. Genome Research 12(12):1805– 1814. https://doi.org/10.1101/gr.631202
Anderson CA, Pettersson FH, Clarke GM, et al. 2010. Data quality control in genetic case-control association studies. Nature Protocols 5:1564– 1573. https://doi.org/10.1038/nprot.2010.116
Decker JE, McKay SD, Rolf MM, et al. 2014. Worldwide patterns of ancestry, divergence, and admixture in domesticated cattle. PLoS Genetics 10(3):e1004254. https://doi.org/10.1371/journal.pgen.1004254
Gautier M, Laloë D, Moazami-Goudarzi K. 2010. Insights into the genetic history of French cattle from dense SNP data on 47 worldwide breeds. PLoS ONE 5(9):e13038. https://doi.org/10.1371/journal.pone.0013038
Jolliffe IT. 2002. Principal component analysis. 2nd ed. Springer. https://doi.org/10.1007/b98835
Makina SO, Muchadeyi FC, van Marle-Köster E, et al. 2015. Genome-wide scan for selection signatures in six cattle breeds in South Africa. Genetics Selection Evolution 47:92. https://doi.org/10.1186/s12711-015-0173-x
Marees AT, de Kluiver H, Stringer S, et al. 2018. A tutorial on conducting genome-wide association studies: Quality control and statistical analysis. International Journal of Methods in Psychiatric Research 27(2):e1608. https://doi.org/10.1002/mpr.1608
McTavish EJ, Decker JE, Schnabel RD, et al. 2013. New World cattle show ancestry from multiple independent domestication events. Proceedings of the National Academy of Sciences of the United States of America 110(15):E1398–E1406. https://doi.org/10.1073/pnas.1303367110
Patterson N, Price AL, Reich D. 2006. Population structure and eigenanalysis. PLoS Genetics 2(12):e190. https://doi.org/10.1371/ journal.pgen.0020190
Purcell S, Neale B, Todd-Brown K, et al. 2007. PLINK: A tool set for whole-genome association and population-based linkage analyses. American Journal of Human Genetics 81(3):559–575. https://doi.org/10.1086/519795
Strucken EM, Swaminathan M, Gibson JP. 2021. Small SNP panels for breed proportion estimation in Indian crossbred dairy cattle. Journal of Animal Breeding and Genetics 138(6):698–707. https://doi.org/10.1111/jbg.12544
Weir BS, Cockerham CC. 1984. Estimating F-statistics for the analysis of population structure. Evolution 38(6):1358–1370. https://doi.org/10.1111/ j.1558-5646.1984.tb05657.x
Wright S. 1978. Evolution and the genetics of populations. Vol. 4: Variability within and among natural populations. University of Chicago Press.