Cheol Hyun Myung1, Tae Wook Kim2, Sa Hyun Lee2, Doo Ha Yang2, Ho Chan Kang1, Ji Yeong Kim1, Hyun Tae Lim1,3*, Sang Hyun Han2*![]()
1Division of Animal Science, College of Agriculture and Life Science, Gyeongsang National University, Jinju 52725, Korea
2National Park Institute for Wildlife Conservation, Korea National Park Service, Gurye 57616, Korea
3Institute of Agriculture and Life Science, Gyeongsang National University, Jinju 52828, Korea
Correspondence to Hyun Tae Lim, E-mail: s_htim@gnu.ac.kr; Sang Hyun Han, Email: hansh04@knps.or.kr
Volume 10, Number 1, Pages 13–24, March 2026.
Journal of Animal Breeding and Genomics 2026, 10(1), 13–24. https://doi.org/10.12972/jabng.2026.10.1.2
Received on March 09, 2026, Revised on March 24, 2026 , Accepted on March 24, 2026 , Published on March 31, 2026 .
Copyright © 2026 Korean Society of Animal Breeding and Genetics.
This is an Open Access article distributed under the terms of the Creative Commons Attribution Non-Commercial License (http://creativecommons.org/licenses/by-nc/4.0).

Since the endangered Asiatic black bear restoration project began in South Korea, the wild population has recently been over 100 bears. This study examined the genetic diversity and population structure of the current bear population using microsatellite genotypes. Mean observed and expected heterozygosities and polymorphic information content were 0.691±0.108, 0.712±0.046 and 0.663±0.272 in the entire population, respectively, demonstrating that this bear population maintained a relatively high level of genetic diversity. The population structure analysis results indicate that ΔK was the highest (11.65) when K was set at 5, suggesting that the population originated from at least five genetic clusters. The principal component analysis (PCA) results showed that bears reintroduced from Northeast Asia are not distinguished by region-specific genetic clusters, estimating that they has been evolved from a single common origin. The progeny population showed the decreased genetic diversity compared to the founder population, which is estimated to be a result of inbreeding and reproductive dominance by a small number of superior bears. When offspring produced through captive breeding were supplied to the wild, genetic diversity was shown to increase. The results of this study suggest that in order to improve the genetic diversity and ensure the genetic stability of this Asiatic black bear population, it is necessary to manage some dominant breeding superiors in the wild, supply offspring through human-assisted reproduction such as artificial insemination, reintroduce new bears from overseas. This study will provide critical information for establishing management programs and policy for future direction of co-existence with the endangered Asiatic black bears in South Korea beyond restoration.
Asiatic black bear, Endangered, Genetic diversity, Microsatellite, Population structure
19세기 이후 급속한 산업화와 도시화의 진행으로 사람의 활동영역은 급속히 확장되었으나, 야생동물은 사냥과 포획에 따른 직접적인 개체군 감소, 서식지 소멸과 지리적 단절 등으로 극심한 피해를 당하게 되었다. 야생동물 집단이 외부 서식지와 유전적 흐름이 차단되면 집단의 유전적 다양성이 감소되고 안정성에 심각한 문제가 발생하게 된다(Fahrig, 2002; Wultsch et al., 2016; Baden et al., 2019). 고립된 집단에서의 근친이나 우점 개체에 의한 번식 독점은 열성 대립유전자를 증가시켜, 유전질환 증가, 출생률 감소, 질병 저항성 감소 등을 유발하며 집단의 장기적인 생존력도 위협받게 된다(Charpentier et al., 2008; Johnson et al., 2010; Grogan et al., 2017). 이에 따라 멸종위기에 처한 야생동물의 유전적 다양성과 안정성, 서식지 간 연결성에 대한 평가는 현재의 상태를 진단할 수 있는 중요한 정보가 되고 있다(Zeyl et al., 2009; Menchaca et al., 2019; Shimozuru et al., 2019).
야생동물의 생태와 유전현상을 분자 수준에서 이해하기 위해 다양한 분자유전학 연구들이 추진되고 있으며, 최근 유전적 다양성 분석에 있어 유전체 수준에서의 단일염기변이(single nucleotide polymorphism, SNP)를 이용한 연구결과들이 활발히 연구되고 있다(Knief et al., 2015; Miller et al., 2024; Zhang et al., 2024). 하지만 분변이나 털과 같은 비침습적 시료가 포함되는 경우는 낮은 유전체 DNA 수율, 다른 생물종에 의한 오염, 공기 중에서 산화에 의한 DNA 붕괴 등의 이유로 모계유전 마커인 미토콘드리아 DNA나 핵 DNA의 미세부수체(microsatellite, MS) 마커에 대한 연구결과들이 주로 보고되었다(Singh et al., 2017; Mengulluoglu et al., 2019; Tumendemberel et al., 2019; Buono et al., 2022). 핵 DNA의 MS는 부모 양친에게서 물려받으며, 빠른 돌연변이를 통해 다양한 대립유전자형 다형성을 나타내어(Weber and Wong 1993; Payseur et al., 2011), 종 내에서 집단 간 유연관계, 유전적 혈통 구조, 친자확인, 동일성검사와 개체식별 등 법의학적 분석이나 이력 추적, 야생동물 집단 크기 예측과 유전적 다양성 평가 등 여러 분야에서 연구되었다(Rosenberg et al., 2002; Kane and King, 2009; Lim et al., 2009; Ramirez-Garcia et al., 2025). 곰과 동물에서도 MS 마커 정보는 집단의 유전적 구조를 해석하거나 친자확인, 번식과 관련된 짝짓기 양상, 피해유발 개체를 확인하는 데 이용되고 있다(Schenk and Kovacs, 1995; Yamamoto et al., 2013; Moore et al., 2015).
20세기 초 일제강점기(1910-45) 동안 ‘해수구제’의 명분으로 호랑이, 표범, 늑대를 비롯한 반달가슴곰 등 대형 식육동물들이 사냥되어 야생 개체군이 급격히 감소하였고, 이후 한국전쟁(1950-53)과 경제발전기(1906년대-현재)를 거치면서 대다수의 종들이 절멸상태에 이르렀다(reviewed in Kim et al., 2011). 2000년대 초 지리산에서 반달가슴곰의 서식이 확인된 이후 동북아시아에 분포하는 반달가슴곰(Ursus thibetanus)이 진화적 유의적인 단위로써 공통의 진화 선조에서 유래된 계통이라는 연구결과들(Hong, 2005; Yasukoshi et al., 2009; Kim et al., 2011; Wu et al., 2015)을 근거로 해외(러시아, 중국, 북한)에서 재도입하여 반달가슴곰 복원이 추진되었다(KNPS, 2009). 이후 야생 개체군이 회복되고 있는 중이며(Lee and Jeong, 2009; Kim et al., 2011), 현재 100개체 이상이 야생에서 서식하고 있다. Kim et al. (2011)은 기존에 곰과 동물에서 보고된 MS 마커들을 이용하여 북한과 러시아 개체들이 유전적으로 구분되지 않는다고 보고하였고, 최근에는 반달가슴곰 우수리아종(U. thibetanus ussuricus)의 전장 유전체에서 개체 식별력이 높은 MS 마커들을 제안하였다(Park et al., 2017; Myung et al., 2025). 하지만 반달가슴곰 복원이 개시된 이후 20여 년의 이 지난 지금 반달가슴곰 집단의 유전적 집단 구조와 유전적 다양성의 변화를 판단할 수 있는 연구결과는 보고되지 않았다.
이 연구는 대한민국 지리산국립공원을 포함한 남부권에서 서식중인 반달가슴곰 집단에서 핵 DNA의 MS 마커 대립유전자형에 근거한 유전적 다양성과 집단 구조, 근교계수의 변화를 평가하여, 야생 반달가슴곰 집단의 유전적 안정성을 향상시키는 데 필요한 기초자료를 제공하고자 하였다.
유전자 분석에 이용된 시료는 총 113개체의 DNA를 이용하였다. 북한, 중국, 러시아에서 재도입된 개체들과 야생에 방사된 이후 생포틀에 포획된 개체들은 건강검진을 위한 채혈과정에서 혈액을 수집하였고, 곰 출현 제보지역이나 곰-사람 충돌사고 현장에서 수집된 털이나 분변, 폐사한 개체의 혈액이나 조직, 분변 등을 수집하여 DNA 분리에 이용하였다. 재도입 개체들(n=52) 중 야생에 방사되지 않았거나, 야생에서 서식이 어렵다고 판단되어 방사 후 단기간 내에 보호시설로 되돌아온 개체들은 분석에서 제외하고 선조집단(n=37)을 선정하였다. 후손집단1 (n=76)은 야생에서 어미곰과 함께 확인된 새끼, 포획된 개체들 중 재도입 선조가 아닌 경우(n=50)와 시설 내에서 인공수정이나 인공증식으로 출생한 후손(n=9), 곰-사람의 충돌 현장에서 수집된 털이나 분변, 피부 잔여물에서 수진된 비침습적 시료들(n=7)을 모두 포함하며, 후손집단2 (n=67)는 후손집단1에서 시설 내 증식을 통해 생산된 개체들을 제외하였다(Table 1). 수집된 혈액과 조직, 피부 잔여물은 DNeasy Blood & Tissue Kit (Qiagen, Hilden, Germany), 털은 QIAamp DNA Micro Kit (Qiagen, Hilden, Germany), 분변에서는 QIAamp PowerFecal DNA Kit (Qiagen, Hilden, Germany)를 이용하여 DNA를 추출하였다. 추출한 DNA는 DS-11 UV/Vis Spectrophotometer (Denovix, USA)로 흡광도(A230, A260, A280)를 측정한 후, A260/A230, A260/A280의 비율이 모두 1.8 이상인 DNA를 중합효소연쇄반응(polymerase chain reaction, PCR)을 위한 주형으로 이용하였다. 털과 분변, 피부 잔여물에서 추출한 DNA는 함량, 순도와 상관없이 PCR 증폭에 이용하였다.
Table 1. Sample information for genetic diversity analysis in the Asiatic black bear population in South Korea
| Population | No.\of animals tested | Re-introduced | Facility-born* | Wild-born** |
|---|---|---|---|---|
| Overall | 113 | 37 | 9 | 67 |
| Founder | 37 | 37 | – | – |
| Progeny 1 | 76 | – | 9 | 67 |
| Progeny 2 | 67 | – | – | 67 |
*includes the cubs produced by artificial insemination and captive breeding.
**includes non-invasive samples such as scats, hairs and skin-debris collected in the wild and/or the on-field specimens from human-bear conflict.
개체별 핵 DNA MS 마커 대립유전자형 정보를 얻기 위해 반달가슴곰 우수리아종의 개체식별을 위해 제안된 20개의 마커들(Myung et al., 2025)을 이용하였다. 20개의 마커들은 각각 FAM, NED, VIC, PET 형광염료로 표지하였고, Myung et al. (2025)에서 제안된 2개의 세트로 나누어 multiplex PCR 방법으로 증폭하였다. PCR은 주형 DNA와 프라이머 혼합액, Multiplex Plus PCR Kit (Qiagen, Hilden, Germany)와 혼합하여 10 ul로 반응하였고, Mastercycler Nexus Gradient (Eppendorf, Hamburg, Germany)를 이용하여 touch-down PCR 기법으로 증폭하였다. PCR 반응의 초기 변성은 95℃에서 10분 간 초기 변성한 후, 94℃-60초, 61℃-75초, 72℃-60초의 1차 연쇄반응을 5회, 94℃-60초, 60℃-75초, 72℃-60초의 2차 연쇄반응을 5회, 94℃-60초, 59℃-75초, 72℃-60초의 3차 연쇄반응을 25회 반복한 후, 65℃에서 30분건 최종 신장하였고, 10℃에서 저장하였다. 증폭이 끝난 PCR 산물은 1.5% agarose 겔 상에서 전기영동하여 확인하고, GeneScan 500 LIZ Dye Size Standard (Life Technologies Ltd., Woolston, WA, UK)와 혼합하여 자동염기서열 분석장치 ABI Automated DNA Sequencer 3730XL (Applied Biosystems, Foster City, CA)을 이용하여 길이별로 구분되도록 전개하였다. 대립유전자형의 결정은 GeneMapper ver. 5 (Applied Biosystems, Foster City, CA) 프로그램을 이용하여 PCR 산물의 길이와 형광표지자의 종류별(FAM, NED, VIC, PET)로 분류하였다. MS 대립유전자형 판독의 정확성을 높이기 위해 각각의 시료에 대한 대립유전자형 판독은 3회 이상 반복하였고, 일치하지 않는 대립유전자형이 산출되는 경우는 개별 마커를 독립적인 PCR로 증폭한 후 다시 판독하였다. 시료 중 분변, 털, 피부 잔여물 등 비침습적 시료 유래의 DNA는 단일 MS 마커 PCR을 3회 이상 수행하여 대립유전자형을 판독하였다.
각각의 유전자 좌위에서 발견된 대립유전자형을 근거로 반달가슴곰 집단의 유전적 다양성을 분석하였다. 대립유전자 수(k), 관찰이형접합율(observed heterozygosity, Hobs), 기대이형접합율(expected heterozygosity, Hexp), 다형정보량(polymorphic information contents, PIC), null allele 빈도(Fnull) 산출과 Hardy-Weinberg (HW) 평형 시험은 CERVUS ver. 3.0.3 (Kalinowski et al., 2007)을 이용하였고, HW 평형 시험에서 분산의 유의성은 95% 신뢰구간에서 Bonferroni correction으로 보정하여 결정하였다. 분석 프로그램 간 입력자료의 변환은 Microsatellite Analyser (MSA) ver. 4.05 (Dierginger and Schlotterer, 2003)를 이용하였다. Weir and Hill (2002)의 방법에 근거한 근교계수(Fis)는 FSTAT ver 2.9.4 (Goudet, 2001)과 GENEPOP ver. 4.7.3 (Raymond and Rousset, 1995)으로 계산하였다. 집단의 유효개체군 크기(effective population size, NE)의 예측을 위해, 현재 집단에 대한 NE-WD는 유전자 좌위 간 대립유전자의 무작위적인 연관을 근거로 Waples and Do (2008)의 방법으로, 과거 집단에 대한 NE-Hill은 단일 표본 추정법(Hill, 1981)으로 결정하였고, NE 값은 LDNe (Waples and Do, 2008)으로 산출하였다. 유전적 평형 시험에서 PHW 값은 GENEPOP을 이용하여 산출하였다. 집단의 유전적 구조 분석은 STRUCTURE ver 2.3.4 (Pritchard et al., 2000; Falush et al., 2003, 2007; Hubisz et al., 2009)를 활용하였다. Bayesian 접근법으로 K=2-10으로 설정하고, Evanno et al. (2005)의 방법으로 산출한 ΔK 값을 기준으로 StructureSelector (Li and Liu, 2018)를 이용하여 유전적 집단 구조를 도식화하였다. 개체 간 유전적 상관관계 확인을 위해 R software (v. 4.5.2)의 adegenet 패키지(Jombart, 2008)를 이용하여 대립유전자형 자료를 수치형 행렬로 변환한 후, PCA 분석을 수행하였다.
지리산국립공원을 포함한 남부권역에서 복원중인 반달가슴곰 집단에서 MS 유전자 좌위의 대립유전자형의 분포에 대한 유전적 다양성을 확인하였다(Table 2). 전체 집단(n=113)에서 MS 유전자 좌위에 대한 대립유전자 수(k)는 3개(ABB601)에서 10개(ABB205)까지의 범위에서 관찰되었고, 평균은 6.3±1.9개였다. 관찰이형접합율(Hobs)은 0.393 (ABB203)에서 0.898 (ABB214)까지의 범위였고, 평균은 0.691±0.108이었다. 기대이형접합율(Hexp)은 0.635 (ABB307)에서 0.785 (ABB212)까지의 범위였고, 평균은 0.712±0.046이었다. 다형정보량(PIC)은 0.563 (ABB601)에서 0.747 (ABB212)의 범위였으며, 평균은 0.663±0.058을 나타내었다. 분석된 MS 마커들로부터 높은 수준의 k, Hobs, Hexp, PIC 값을 나타낸다는 점은 이 마커들의 다형성이 높아, 유전적 다양성에 대한 연구에 충분한 정보력이 있는 것으로 판단된다(Zhou et al., 2021; Myung et al., 2025).
Table 2. Genetic diversities, inbreeding coefficient (Fis), and Hardy-Weinberg equilibrium test results for each locus in the Asiatic black bear population in South Korea
| Locus | Entire population (n=113) | ||||||
|---|---|---|---|---|---|---|---|
| k | Hobs | Hexp | PIC | Fnull | Fis | PHW1 | |
| ABB201 | 9 | 0.699 | 0.751 | 0.710 | 0.035 | 0.039 | N.S. |
| ABB203 | 6 | 0.393 | 0.668 | 0.621 | 0.260 | 0.470 | *** |
| ABB205 | 10 | 0.655 | 0.729 | 0.691 | 0.055 | 0.098 | *** |
| ABB206 | 7 | 0.667 | 0.756 | 0.717 | 0.064 | 0.134 | ** |
| ABB207 | 6 | 0.830 | 0.779 | 0.742 | -0.032 | -0.062 | N.S. |
| ABB208 | 9 | 0.750 | 0.734 | 0.693 | -0.008 | -0.008 | N.S. |
| ABB209 | 7 | 0.795 | 0.770 | 0.736 | -0.014 | -0.034 | N.S. |
| ABB211 | 4 | 0.611 | 0.700 | 0.643 | 0.069 | 0.180 | *** |
| ABB212 | 7 | 0.775 | 0.785 | 0.747 | 0.003 | 0.042 | *** |
| ABB213 | 6 | 0.639 | 0.695 | 0.651 | 0.047 | 0.147 | *** |
| ABB214 | 5 | 0.898 | 0.680 | 0.635 | -0.175 | -0.226 | *** |
| ABB222 | 6 | 0.645 | 0.721 | 0.671 | 0.058 | 0.138 | *** |
| ABB306 | 6 | 0.631 | 0.689 | 0.631 | 0.034 | 0.112 | *** |
| ABB307 | 7 | 0.586 | 0.635 | 0.564 | 0.039 | 0.115 | *** |
| ABB308 | 7 | 0.770 | 0.769 | 0.730 | -0.003 | -0.022 | N.S. |
| ABB401 | 8 | 0.732 | 0.715 | 0.675 | -0.013 | -0.010 | ** |
| ABB413 | 6 | 0.637 | 0.691 | 0.639 | 0.040 | 0.049 | N.S. |
| ABB502 | 3 | 0.658 | 0.659 | 0.582 | -0.004 | 0.033 | ** |
| ABB503 | 4 | 0.786 | 0.680 | 0.610 | -0.078 | -0.150 | *** |
| ABB601 | 3 | 0.667 | 0.642 | 0.563 | -0.026 | 0.001 | *** |
| Mean | 6.3 | 0.691 | 0.712 | 0.663 | 0.017 | 0.052 | |
| SD | 1.9 | 0.108 | 0.046 | 0.058 | 0.081 | 0.141 | |
다른 야생 포유동물에서 보고된 MS 대립유전자형에 대한 유전적 다양성 지수 중 Hobs, Hexp는 중국의 Ebinur 자연보호구역의 붉은사슴은 각각 0.662, 0.777, 인도에 서식하는 국제적 멸종위기종 벵갈호랑이는 각각 0.549-0.766, 0.648-0.860, 튀르키예 Nallihan 산맥의 스라소니는 각각 0.69, 0.65, 중국의 Fanjingshan의 멸종위기종 들창코원숭이는 각각 0.71, 0.70을 나타내어(Kolleck et al., 2013; Kolipakam et al., 2019; Mengulluoglu et al., 2019; Wu et al., 2025), 이번 연구의 반달가슴곰 복원집단과 비슷하거나 다소 높은 범위였으며, Hexp가 0.6 이상으로 높은 수준의 유전적 다양성을 나타내고 있었다(Botstein et al., 1980; Zhou et al. 2021). 반면, 미국 Washington 지역의 퓨마는 각각 0.52, 0.59, 중국의 삵은 각각 0.392, 0.514 (Wultsch et al., 2023; Teng et al., 2022)로 이번 연구의 반달가슴곰 집단보다 낮은 수준을 보였다.
국내 야생 포유동물에서 보고된 연구결과에서는 너구리에서 Hobs, Hexp는 각각 0.619, 0.723로 반달가슴곰 집단과 비슷하고, 고라니에서 각각 0.533, 0.622, 산양의 야생집단에서 0.603-0.640, 0.630-0.697로 반달가슴곰 집단보다 다소 낮은 수준이나, 삵 집단에서는 각각 0.41, 0.41로 더 낮은 양상을 나타내었다(Lee et al., 2011; Hong et al., 2013; Choi et al., 2015; Ko et al., 2018; Kim et al., 2025). 국내 야생 포유동물 중 개체수가 상대적으로 더 많고, 지리적 분포가 넓은 너구리, 고라니, 산양에 비해서도 반달가슴곰 집단에서 확인된 Hobs와 Hexp의 수준이 비슷하거나 더 높은 이유는 복원집단의 기원이 러시아 연해주, 중국 동북부, 북한 등 여러 지역에서 재도입된 데에서 기인한 것으로 보인다. 이번 연구결과는 Kim et al. (2011)의 연구결과에서 제시된 러시아, 북한 개체들의 Hobs (0.589), Hexp (0.687) 값보다도 다소 높은 수준이었다. 비록 분석된 MS 마커의 종류가 서로 다르기 때문에 직접적인 비교는 불가능하지만, 현재의 반달가슴곰 집단은 러시아와 북한뿐만 아니라 중국 동북부 개체들이 추가로 재도입된 결과이며, 재도입 개체들이 방사된 이후 출생한 후손들도 유전적 다양성이 어느 정도 잘 유지되고 있는 것으로 추론되는 결과이다.
같은 곰과 동물에서는 미국 Alabama의 아메리카흑곰이나 이탈리아 중부의 불곰, Kodiac Island의 불곰 집단은 지리적으로 격리되어 있고 규모가 작아 유전적 다양성이 낮으나(Paetkau et al., 1998; Draper et al., 2017; Buono et al., 2022), 히말라야의 반달가슴곰, 중국의 자이언트 판다, 불곰, 북극곰 등 주변 서식지와 유전적 연결성이 좋은 집단들은 유전적 다양성이 높은 상태로 확인되었다(Paetkau and Strobeck, 1994; Malenfant et al., 2016; Kadariya et al. 2018; Qiao et al., 2018; Tumendemberel et al., 2019). 이번 연구 대상인 반달가슴곰 집단은 인근 다른 서식지와는 지리적으로 완전히 격리되어 있으나, 복원을 위해 재도입된 개체들이 해당 지역에서 이미 높은 수준의 유전적 다양성을 보유했던 개체들이었던 것으로 추정된다. 이형접합율 이외에 PIC 역시 집단의 유전적 다양성을 평가하는 데 있어 핵심적인 요인으로 간주되며(Botstein et al., 1980), 반달가슴곰 복원집단은 PIC가 0.6 이상인 높은 수준의 유전적 다양성을 보였고, 네팔 반달가슴곰 집단, 아시아코끼리, 중국의 붉은사슴 등 이형접합율이 높은 포유동물들에서도 PIC의 수준이 높았다(Kadariya et al., 2018; De et al., 2021; Wu et al., 2015).
분석된 마커들에서 null 대립유전자의 빈도(Fnull)는 –0.226에서 0.260의 범위였고, 평균은 0.017±0.081로 낮은 수준을 보였다. ABB203의 Fnull가 0.260으로 이형접합 결손에 대한 Brookfield의 빈도(<0.2)보다 높아, 근친을 판단할 수 있는 가능성이 증가되지만, 전체적인 Fnull가 낮아 신뢰성이 높은 체계로 판단된다(Dakin and Avise, 2004). 유전적 다양성 분석에서 높은 Fnull을 나타내었던 ABB203을 제외한 19개 MS 마커의 대립유전자형을 이용하여 유효개체군크기(effective population size, NE)를 산출한 결과, Waples and Do (2008)의 NE-WD=18 (95% CI: 10–45), 단일 표본 추정법(Hill, 1981)의 NE-Hill=300-800을 나타내었다. 이 결과에서 NE-Hill=300-800의 수준은 과거 이 집단은 유효개체군이 매우 많은 집단이었고, NE-WD<20은 현재 이 집단의 유효개체군이 매우 적음을 의미한다(Frankham et al., 1996; Singh et al., 2017). 이는 해외에서 도입된 선조들 중 일부만 유전적으로 기여하고 있으며, 지역적으로 고립된 소집단 규모임을 나타내고 있다. 근교계수 Fis는 –0.226에서 0.470의 범위였고, 평균 0.052±0.141이었다(Table 2). Fis가 양의 값인 결과는 집단 내에서 근친 발생의 가능성을 나타낸다. 유전적 평형 분석 결과에서는 ABB203 뿐만 아니라, ABB211, ABB214 등 여러 마커에서 HW 평형을 벗어난 결과를 보였다(PHW<0.05)(Table 2). 이 결과들은 null allele의 가능성, 선택압, 또는 집단 구조의 효과나 근친 등에 의해 발생할 수 있다(Frankham et al., 1993; Miller et al., 2024). 즉, NE-WD가 적고, HW 평형을 벗어난 마커들이 다수이며, Fis가 양의 값을 보이는 이 결과들은 과거의 동북아시아 반달가슴곰 집단은 NE가 크고, 유전적 다양성이 높은 안정적인 집단이었으나(Yasukoshi et al., 2009; Kim et al., 2011; Wu et al., 2015), 현재 대한민국에서 복원중인 집단은 지리적으로 격리된 소집단이며, 근친발생의 가능성이 있으며, 유전적 부동이 강하여 유전적 다양성이 감소중인 집단임을 보여주고 있다.
Bayesian 접근법을 이용하여 대립유전자형 분포에 대한 집단의 유전적 구조를 분석한 결과, 유전적 계보의 수를 나타내는 K=2부터 10까지인 model에서 ΔK의 범위는 0.296-11.650을 나타내었고, K=5에서 ΔK 값=11.65로 최적의 상태를 나타내었다. 이 결과는 반달가슴곰 집단이 5개의 유전적 계보에서 유래되었음을 보여준다. 선조집단인 러시아, 중국, 북한 재도입 개체들이 지역-특이적인 양상을 나타내지 않았고, 개체 내에서 여러 가지 유전적 계보들이 혼재된 양상을 보였다(Fig. 1A). 유전적 거리지수에 근거한 PCA 분석 결과에서 PC1 (x-축)과 PC2 (y-축)는 전체 유전적 변이의 15.45% (PC1, 8.97%; PC2, 6.48%)에 해당하였다. PC1에서는 중국에서 재도입된 3개체가 독립적인 위치를 나타내었으나, 1개체는 러시아, 북한 개체들 사이에 위치하는 양상을 보여(Fig. 1B), 세 지역이 완전히 분화된 형태를 보이지는 않았다. 이 결과는 한반도, 중국 동북부, 러시아 연해주 등 동북아시아에 분포하는 반달가슴곰들이 우수리아종이라는 단일 계통에서 진화되었다는 선행 연구결과들(Yasukoshi et al., 2009; Kim et al., 2011; Wu et al., 2015)과 일치한다. 비록 현재는 국경에 의해 지리적으로 격리되어 있으나, 과거 오랜 진화과정 동안 동북아시아 반달가슴곰은 지리적 격리 없이, 이동과 번식이 자유로웠을 것이다. Kim et al. (2011)의 연구결과에서 러시아, 북한 개체들이 2개의 유전적 계보(K=2)에 의해 형성되었으나, 분석된 개체들 모두 2개의 계보를 공통으로 보유하고 있었다. 이번 연구에서는 러시아, 북한뿐만 아니라 중국 개체들이 추가되면서 Kim et al. (2011)의 연구결과 보다 더 다양해진 것으로 판단된다. 분포지역이 넓고 이동성이 강한 북극곰, 아시아코끼리, 남아시아의 호랑이 등은 유전적 계보가 많았으나(K≥4) (Malenfant et al., 2016; Kolipakam et al., 2019; De et al., 2021), 히말라야의 반달가슴곰, Alabama의 아메리카흑곰, 이탈리아 중부의 불곰, 인도-네팔 Terai 지역의 호랑이, Washington의 퓨마 등 지리적으로 격리되거나 서식지의 규모가 작은 경우 유전적 계보가 적은 양상(K≤2)을 보였다(Draper et al., 2017; Singh et al., 2017; Wultsch et al., 2023). 이번 연구에서 분석된 반달가슴곰 집단은 지리적 기원이 러시아 연해주, 중국 동북부, 북한 등 동북아시아에서 재도입한 개체들과 그 후손들로 이루어진 집단이므로 선조집단의 다양한 유전적 계보가 반영된 결과라 하겠다.
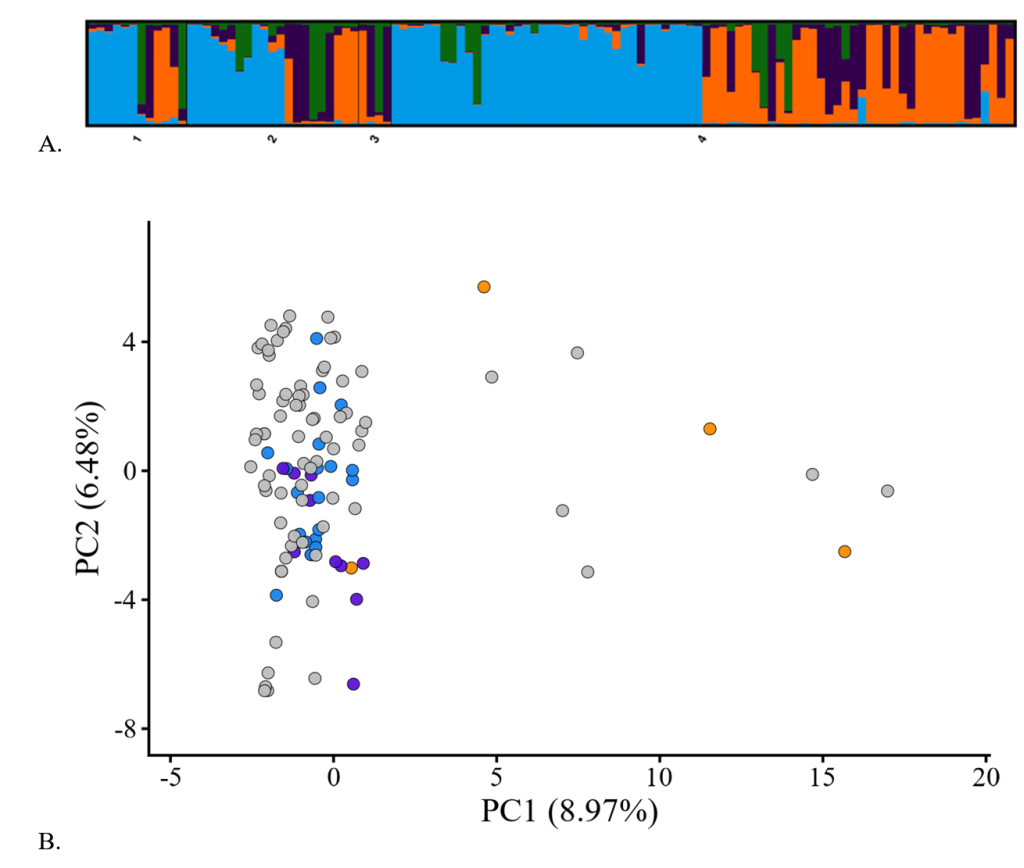
Figure 1. Results of genetic structure using Bayesian model-based clustering (A) and principle component analysis for MS genotypes (B) in the Asiatic black bear population restoring in South Korea. A, numbers below bar-plot indicate the founders (1-3) reintroduced from North Korea (1), Russia (2), and China (3), and the progeny (4). B, circles indicate the founders reintroduced from Russia (blue), North Korea (purple), and China (orange), and the progeny (gray).
분석된 개체들 중에서 해외에서 재도입된 개체들로 구성된 선조집단(n=37)에서 k는 6.1±1.8개, Hobs는 0.681±0.157, Hexp는 0.718±0.049, PIC는 0.662±0.060, 전체 출생개체를 모두 포함하는 후손집단1 (n=76)에서 k는 5.9±1.6개, Hobs는 0.696±0.109, Hexp는 0.704±0.052, PIC는 0.651±0.063, 야생에서 출생한 개체들만 포함하는 후손집단2 (n=67)에서 k는 5.2±1.2개, Hobs는 0.690±0.113, Hexp는 0.687±0.054, PIC는 0.631±0.066을 나타내었다(Table 3). 즉, 후손집단에서 선조집단에 비해 대립유전자형의 수가 감소하였으며, 이형접합율과 다형정보량 역시 감소한 양상이었다.
| Locus | Founder population (n=37) | Progeny population 1(Wild- & facility-born, n=76) | Progeny population 2 (Wild-born, n=67) | |||||||||||||||
|---|---|---|---|---|---|---|---|---|---|---|---|---|---|---|---|---|---|---|
| k | Hobs | Hexp | PIC | Fis | PHW | k | Hobs | Hexp | PIC | Fis | PHW | k | Hobs | Hexp | PIC | Fis | PHW | |
| ABB201 | 9 | 0.568 | 0.673 | 0.629 | 0.138 | N.S. | 8 | 0.763 | 0.768 | 0.725 | 0.006 | N.S. | 6 | 0.731 | 0.749 | 0.700 | 0.024 | N.S. |
| ABB203 | 6 | 0.444 | 0.700 | 0.642 | 0.368 | *** | 6 | 0.366 | 0.650 | 0.601 | 0.506 | *** | 6 | 0.355 | 0.647 | 0.594 | 0.528 | *** |
| ABB205 | 10 | 0.757 | 0.769 | 0.726 | -0.026 | N.S. | 9 | 0.605 | 0.711 | 0.670 | 0.149 | *** | 6 | 0.567 | 0.677 | 0.627 | 0.163 | ** |
| ABB206 | 6 | 0.500 | 0.737 | 0.683 | 0.337 | *** | 6 | 0.747 | 0.759 | 0.719 | 0.037 | * | 6 | 0.742 | 0.760 | 0.717 | 0.047 | ** |
| ABB207 | 6 | 0.917 | 0.809 | 0.767 | -0.117 | N.S. | 6 | 0.789 | 0.759 | 0.718 | -0.041 | N.S. | 6 | 0.791 | 0.726 | 0.681 | -0.091 | N.S. |
| ABB208 | 9 | 0.861 | 0.764 | 0.721 | -0.155 | N.S. | 6 | 0.697 | 0.718 | 0.669 | 0.029 | N.S. | 5 | 0.701 | 0.692 | 0.644 | -0.014 | N.S. |
| ABB209 | 6 | 0.722 | 0.707 | 0.669 | -0.024 | N.S. | 7 | 0.829 | 0.791 | 0.756 | -0.048 | N.S. | 7 | 0.806 | 0.786 | 0.750 | -0.026 | N.S. |
| ABB211 | 4 | 0.543 | 0.673 | 0.615 | 0.304 | *** | 4 | 0.644 | 0.693 | 0.631 | 0.137 | *** | 4 | 0.672 | 0.691 | 0.627 | 0.105 | ** |
| ABB212 | 6 | 0.639 | 0.764 | 0.714 | 0.109 | *** | 7 | 0.840 | 0.791 | 0.753 | -0.041 | *** | 6 | 0.879 | 0.792 | 0.753 | -0.086 | *** |
| ABB213 | 6 | 0.676 | 0.712 | 0.661 | -0.117 | ** | 6 | 0.620 | 0.689 | 0.643 | 0.203 | *** | 5 | 0.581 | 0.662 | 0.609 | 0.240 | *** |
| ABB214 | 5 | 0.973 | 0.708 | 0.655 | -0.400 | *** | 5 | 0.859 | 0.667 | 0.620 | -0.160 | *** | 5 | 0.839 | 0.654 | 0.607 | -0.136 | *** |
| ABB222 | 6 | 0.667 | 0.723 | 0.669 | 0.138 | N.S. | 6 | 0.635 | 0.722 | 0.669 | 0.160 | *** | 5 | 0.646 | 0.696 | 0.634 | 0.122 | ** |
| ABB306 | 6 | 0.583 | 0.719 | 0.659 | 0.206 | * | 6 | 0.653 | 0.677 | 0.616 | 0.060 | *** | 5 | 0.682 | 0.647 | 0.574 | -0.021 | ** |
| ABB307 | 7 | 0.459 | 0.658 | 0.584 | 0.162 | * | 5 | 0.649 | 0.626 | 0.552 | 0.022 | ** | 4 | 0.631 | 0.597 | 0.512 | 0.014 | ** |
| ABB308 | 7 | 0.865 | 0.787 | 0.744 | -0.120 | N.S. | 6 | 0.724 | 0.753 | 0.709 | 0.039 | N.S. | 5 | 0.716 | 0.733 | 0.687 | 0.023 | N.S. |
| ABB401 | 7 | 0.833 | 0.765 | 0.719 | -0.076 | N.S. | 8 | 0.684 | 0.682 | 0.639 | -0.004 | N.S. | 7 | 0.672 | 0.665 | 0.619 | -0.010 | N.S. |
| ABB413 | 6 | 0.649 | 0.734 | 0.675 | 0.085 | N.S. | 6 | 0.632 | 0.641 | 0.593 | 0.016 | N.S. | 6 | 0.642 | 0.637 | 0.587 | -0.008 | N.S. |
| ABB502 | 3 | 0.556 | 0.636 | 0.550 | 0.212 | N.S. | 3 | 0.707 | 0.660 | 0.581 | -0.043 | * | 3 | 0.727 | 0.652 | 0.571 | -0.083 | * |
| ABB503 | 4 | 0.833 | 0.672 | 0.596 | -0.184 | * | 4 | 0.763 | 0.681 | 0.610 | -0.121 | * | 4 | 0.761 | 0.670 | 0.594 | -0.137 | N.S. |
| ABB601 | 3 | 0.583 | 0.647 | 0.563 | 0.151 | * | 3 | 0.707 | 0.633 | 0.555 | -0.085 | ** | 3 | 0.667 | 0.616 | 0.535 | -0.048 | ** |
| Mean | 6.1 | 0.681 | 0.718 | 0.662 | 0.050 | 5.9 | 0.696 | 0.704 | 0.651 | 0.041 | 5.2 | 0.690 | 0.687 | 0.631 | 0.030 | |||
| SD | 1.8 | 0.157 | 0.049 | 0.060 | 0.199 | 1.6 | 0.109 | 0.052 | 0.063 | 0.144 | 1.2 | 0.113 | 0.054 | 0.066 | 0.152 | |||
이와 같이 후손집단에서의 유전적 다양성 감소의 원인은 몇 가지 가설을 통해 나누어 생각해 볼 수 있다. 첫 번째는 집단의 크기와 유전적 다양성의 양의 상관성(Frankham, 1996; Pruett and Winker, 2008)을 고려해볼 수 있다. 하지만, 반달가슴곰 선조집단에 비해 후손집단의 개체수가 더 많으나, 유전적 다양성은 감소하였다. 따라서 집단 내에서 HW 평형을 따르는 임의적인 짝짓기에 의한 번식이 이루어지지 않고 있다고 하겠다. 두 번째는 집단 내 근친에 의한 유전적 다양성의 소실이다(Frankham et al., 1993; Miller et al., 2024). MS 마커에 대한 HW 평형 시험에서 몇 가지 마커들이 HW 평형을 벗어나는(PHW<0.05) 양상이 선조집단과 후손집단에서 모두 관찰되었다. 또한 근교계수 Fis는 선조집단에서 0.050±0.199였으나, 후손집단1에서 0.041±0.144, 후손집단2에서 0.030±0.152로 점차 감소하는 양상을 보였다. 호랑이, 판다, zebra finch를 비롯한 조류에서도 야생집단보다 사육집단(captive population), 동물원집단에서 더 근친이 더 빈번하고, 야생에서는 지리적으로 격리된 소규모 집단에서 더 많이 발생한다고 보고되었다(Crnokrak and Roff, 1999; Knief et al., 2015; Yang et al., 2016; Zhang et al., 2024). 반면, 반달가슴곰 집단의 경우 후손집단의 Fis가 양의 값을 보이지만, 선조집단에 비해 감소된 양상을 보인다는 점은 근친이 유전적 다양성의 감소에 직접적인 원인은 아니라고 판단된다. 또 다른 가설은 집단 내에서 일부 우월한 개체들이 번식을 주도하는 우점적인 번식(predominant reproduction)을 고려할 수 있다. 일반적으로 곰과 동물들은 일생동안 짝짓기 상대에 대한 배우자 충실도가 낮고, 단일 번식기 동안에도 여러 마리의 암컷들과 수컷들이 다중으로 짝짓기를 하며, 수정란이 지연착상을 한다는 점에서 일부다처, 다부일처에 의한 동복다부(multiple paternity) 후손들이 빈번하게 출생하게 된다(Barber and Lindzey, 1986; Schenk and Kovacs, 1995; Zeyl et al., 2009; Chang et al., 2011). 암컷들은 일정한 행동권 내에서 정주하는 양상을 보이지만, 수컷들은 넓은 세력권을 돌아다니면서 다수의 암컷들과 짝짓기를 시도하며, 일단 짝짓기에 성공하면 다른 암컷을 찾아 떠나는 행동 특성을 보이고, 인해 성체 수컷들 간 번식경쟁이 심하고, 아성체 수컷들을 해치는 경우도 발생하며, 결과적으로 소수의 수컷들이 집단의 번식을 우점하게 된다(Barber and Lindzey, 1986; Rogers, 1987; Schenk and Kovacs, 1995). 특히 지리산국립공원과 같이 좁은 서식지에서는 번식기 동안 수컷들 사이에서 암컷과의 짝짓기를 위한 번식경쟁이 치열할 것이며, 우월한 소수 수컷들이 암컷들과의 짝짓기를 우점할 것으로 예상된다. 소수 수컷에 의한 번식 우점은 사회적 생활을 하는 영장류에서 흔할 뿐만 아니라 판다와 곰 등 비사회적인 동물에서도 관찰되며(Sinclair et al., 2003; Muniz et al., 2010; Huang et al., 2012; Parga et al., 2016), 때때로 한 배의 후손들이 다른 아비곰에서 유래되는 동복다부 현상이 나타나게 된다(Sinclair et al., 2003; Zeyl et al., 2009; Yamamoto et al., 2013). 이 가설이 현재 반달가슴곰 집단의 유전적 다양성 감소를 설명하는 데 가장 유력하지만, 이를 검증을 위해서는 향후 친자확인 시험을 통한 양친확인과 가계도 분석을 통해 면밀하게 검토되어야 할 것이다.
야생에서 출생한 후손들만 포함하는 후손집단2는 인공증식 후손까지 포함하는 후손집단1에 비해 유전적 다양성이 더 낮은 수준을 보였다(Table 3). 이 결과는 인공증식 후손들이 야생집단에 공급하는 것이 전체 후손집단의 유전적 다양성에 영향을 미칠 수 있음을 의미한다. 멸종위기 야생동물뿐만 아니라 가축 생산이나 작물 육종에도 인공수정, 인위적 교배 등을 이용한 사람-도움 증식(human-assisted reproduction)은 유전적 다양성을 증가시키는 좋은 방법으로 간주되고 있다(Robert, 2009; Jamieson, 2015; Johnson et al., 2025). 특히, 혈연관계가 먼 개체 간 교배나, 동형접합성이 높은 순계 간 교배는 이형접합성의 증가를 통해 집단의 유전적 다양성을 증가시키고, 환경 적응력과 장기적인 생존력을 향상에 기여한다(David, 1998; Shen et al., 2009; Weeks et al., 2016; Zhang et al., 2024). 반달가슴곰 복원이 추진된 이후 부상에 의한 장애, 야생성 부족 등 여러 가지에 이유로 야생에 서식하지 못하는 개체들을 발생하였다. 이들 시설 내 개체들을 이용하여 인공수정 등 사람-도움 증식으로 후손을 생산하고 야생에 공급한다면, 야생에 없는 양친의 유전자 pool이 야생 집단으로 전달되어, 결과적으로 유전적 다양성을 향상시킬 것이다.
야생동물에서 집단의 유전적 다양성의 증가는 잠재적인 환경 변화에 대한 적응력을 향상시켜, 결과적으로 장기적인 집단의 생존력을 증가시키는 핵심요인으로 작용한다. 동북아시아 지역에서 재도입한 반달가슴곰 선조집단은 다양한 지리적 기원과 유전적 계보가 반영되어 유전적 다양성이 높은 상태를 나타내었다. 하지만 후손집단에서는 유전적 다양성이 감소하였고, 야생 곰들의 번식과정에서 근친의 발생, 소수 우월 개체들에 의한 번식 우점 등에 의한 결과로 추정되었다. 반면, 사람-도움 증식에서 생산된 후손들은 후손집단의 유전적 다양성 향상에 기여하고 있었다. 이번 연구가 MS 마커의 한정된 정보를 이용했다는 점에서 향후 전장 유전체의 SNP 연구를 통해 유전적 다양성의 변화를 포괄적으로 살펴볼 필요가 있으며, 친자확인과 가계도 분석을 통해 이번 연구결과들을 뒷받침할 수 있는 혈통적 근거자료도 마련되어야할 것이다. 현재 대한민국 내에는 유전적 흐름을 통해 유전적 다양성을 자연적으로 증가시킬 수 있는 또 다른 반달가슴곰 집단이 없기 때문에, 번식 우점 개체의 관리, 해외로부터의 추가 도입, 인공증식 후손의 공급 등 다양한 방법으로 야생 반달가슴곰 복원집단의 유전적 다양성을 향상시킬 수 있는 보전정책과 프로그램들이 마련되어야 할 것이다.
No potential conflict of interest relevant to this article is reported.
이 연구는 환경부의 지원을 받아 국립공원공단 국립공원야생생물보전원의 “멸종위기종증식복원및반달가슴곰공존문화조성사업”에서 수행된 연구결과의 일부입니다. 연구비 지원에 감사드립니다.
Baden AL, Mancini AN, Federman S, Holmes SM, Johnson SE, Kamilar J, Louis EE Jr, Bradley BJ. 2019. Anthropogenic pressures drive population genetic structuring across a critically endangered lemur species range. Scientific Reports 9(1):16276.
[DOI][PubMed][PMC]
Barber KR, Lindzey FG. 1986. Breeding behaviour of black bears. International Conference on Bear Research & Management 6:129-136.
[DOI]
Botstein SC, Williams JL, Skolnick M, Davis RW. 1980. Construction of a genetic linkage map in man using restriction fragment length polymorphisms. American Journal of Human Genetics 32:314-331.
Buono V, Burgio S, Macri N, Catania G, Hauffe HC, Mucci N, Davoli F. 2022. Microsatellite characterization and panel selection for brown bear (Ursus arctos) population assessment. Genes 13:2164.
[DOI][PubMed][PMC]
Chang GR, Yang CC, Hsu SH, Lin C, Chiu CL, Chan FT, Mao FC. 2011. Fecal reproductive steroid profiles for monitoring reproductive patterns in female Formosan black bears (Ursus thibetanus formosanus). Annales Zoologici Fennici 48:275-286.
[DOI]
Charpentier MJE, Williams CV, and Drea CM. 2008. Inbreeding depression in ring-tailed lemurs (Lemur catta): Genetic diversity predicts parasitism, immunocompetence, and survivorship. Conservation Genetics 9:1605-1615.
[DOI]
Chen L, Pan T, Qian H, Zhang M, Yang G, Wang X. 2021. Genetic diversity and population structure revealed by SSR markers on endemic species Osmanthus serrulatus Rehder from Southwestern Sichuan Basin, China. Forests 12:1365.
[DOI]
Choi SK, Chun S, An J, Lee M, Kim HJ, Min M, Kwon S, Choi TY, Lee H, Kim KS. 2015. Genetic diversity and population structure of the long-tailed goral, Naemorhedus caudatus, in South Korea. Genes & Genetic Systems 90:31-41.
[DOI][PubMed]
Crnokrak P, Roff DA. 1999. Inbreeding depression in the wild. Heredity 83(3):260-270.
[DOI][PubMed]
Dakin EE, Avise JC. 2004. Microsatellite null alleles in parentage analysis. Heredity 93:504-509.
[DOI][PubMed]
David P. 1998. Heterozygosity-fitness correlations: new perspective on old problems. Heredity 80:531-537.
[DOI][PubMed]
De R, Sharma R, Davidar P, Arumugam N, Sedhupathy A, Puyravaud JP, Selvan KM, Rahim PPA, Udayraj S, Parida J, Digal DK, Kanagaraj R, Kakati K, Nigam P, Williams AC, Habib B, Goyal SP. 2021. Pan-India population genetics signifies the importance of habitat connectivity for wild Asian elephant conservation. Global Ecology and Conservation 32:e01888.
[DOI]
Dierginger D and Schlotterer C. 2003. Microsatellite analyser (MSA): a platform independent analysis tool for large microsatellite data sets. Molecular Ecology Notes 3(1):167-169.
[DOI]
Draper JP, Waits LP, Adams JR, Seals CL, Steury TD. 2017. Genetic health and population monitoring of two small black bear (Ursus americanus) populations in Alabama, with a regional perspective of genetic diversity and exchange. PLoS ONE 12(11):e0186701.
[DOI][PubMed][PMC]
Evanno G, Regnaut S and Goudet J. 2005. Detecting the number of clusters of individuals using the software structure: a simulation study. Molecular Ecology 14:2611-2620.
[DOI][PubMed]
Fahrig L. 2002. Effect of habitat fragmentation on the extinction threshold: A Synthesis. Ecological Applications 12:346-353.
[DOI]
Falush D, Stephens M and Pritchard JK. 2007. Inference of population structure using multilocus genotype data: Dominant markers and null alleles. Molecular Ecology Notes 7: 574-578.
[DOI][PubMed][PMC]
Frankham R. 1996. Relationship of genetic variation to population size in wildlife. Conservation Biology 10:1500-1508.
[DOI]
Frankham R, Smith GJ, Briscoe DA. 1993. Effects on heterozygosity and reproductive fitness of inbreeding with and without selection on fitness in Drosophila melanogaster. Theoretical and Applied Genetics 86(8):1023-1027.
[DOI][PubMed]
Goudet J. 2001. FSTAT, a program to estimate and test gene diversities and fixation indices (ver. 2.9.3). Accessed in https://www2.unil.ch/popgen/softwares/fstat.htm on 01 April 2026.
Grogan KE, Sauther ML, Cuozzo FP, Drea CM. 2017. Genetic wealth, population health: Major histocompatibility complex variation in captive and wild ring-tailed lemurs (Lemur catta). Ecology and Evolution 7(19):7638-7649.
[DOI][PubMed][PMC]
Hill WG. 1981. Estimation of effective population size from data on linkage disequilibrium. Genetical Research 38:209-216.
[DOI]
Hong YJ. 2005. Molecular phylogenetic study on Asiatic black bears (Ursus thibetanus) in Korea: defining the conservation unit of Korean black bears. Dissertation, Seoul, Korea: Seoul National University 53p.
Hong Y, Kim K, Lee H, Min M. 2013. Population genetic study of the raccoon dog (Nyctereutes procyonoides) in South Korea using newly developed 12 nicrosatellite markers. Genes & Genetic Systems 88:69-76.
[DOI][PubMed]
Hubisz MJ, Falush D, Stephens M and Pritchard JK. 2009. Inference of weak population structure with the assistance of sample group information. Molecular Ecology Resour. 9: 1322-1332.
[DOI][PubMed][PMC]
Jamieson AG. 2015. Significance of population genetics for managing small natural and reintroduced populations in New Zealand. New Zealand Journal of Ecology 39(1):1018.
Johnson P, Crossman J, Miller A, Nichols B, McLellan, Howell M, Schreier A. 2025. Conservation aquaculture of wild-origin offspring preserves genetic diversity in an endangered population of white sturgeon. Conservation Genetics 26:335-346.
[DOI]
Johnson WE, Onorato DP, Roelke ME, Land ED, Cunningham M, Belden RC, McBride R, Jansen D, Lotz M, Shindle D, Howard J, Wildt DE, Penfold LM, Hostetler JA, Oli MK, O’Brien SJ. 2010. Genetic restoration of the Florida panther. Science 329:1641-1645.
[DOI][PubMed][PMC]
Jombart T. 2008. adegenet: a R package for the multivariate analysis of genetic markers. Bioinformatics 24:1403-1405.
[DOI][PubMed]
Kadariya R, Shimosuru M, Maldonado JE, Moustafa MAM, Sashika M, Tsubota T. 2018. High genetic diversity and distinct ancient lineage of Asiatic black bears revealed by non-invasive surveys in the Annapurna Conservation Area, Nepal. PLoS ONE 13(12):e0207662.
[DOI][PubMed][PMC]
Kalinowski ST, Taper M and Marshall TC. 2007. Revising how the computer program CERVUS accommodates genotyping error increases success in paternity assignment. Molecular Ecology 16:1099-1106.
[DOI][PubMed][PMC]
Kane NC, King MG. 2009. Using parentage analysis to examine gene flow and spatial genetic structure. Molecular Ecology 18(8):1551-1552.
[DOI][PubMed]
Kitahara E, Isagi Y, Isfibashi Y, Saitoh T. 2000. Polymorphic microsatellite DNA markers in the Asiatic black bear Ursus thibetanus. Molecular Ecology 9:1661-1686.
[DOI][PubMed]
Kim YK, Hong YJ, Min MS, Kim KS, Kim YJ, Voloshina I, Myslenkov A, Smith GJ, Cuong ND, Tho HH, Han SH, Yang DH, Kim CB, Lee H. 2011. Genetic status of Asiatic black bear (Ursus thibetanus) reintroduced into South Korea based on mitochondrial DNA and microsatellite loci analysis. Journal of Heredity 102(2):165-174.
[DOI][PubMed]
Kim YR, Kim H, Kim DH, Jang JE, Son J, Han S, Lee HJ. 2025. Phylogenetic status and population genetic structure of the long-tailed goral, Naemorhedus caudatus inhabiting the Seoraksan National Park in Korea. Korean Journal of Environmental Biology 43(1):28-41.
[DOI]
Knief U, Hemmrich-Stanisak G, Wittig M, Franke A, Griffith SC, Kempenaers B, Forstmeier W. 2015. Quantifying realized inbreeding in wild and captive animal populations. Heredity 114:397-403.
[DOI][PubMed][PMC]
KNPS (Korea National Park Service). 2009. 2004-2008 Monitoring and research report if Asiatic black bear in Jirisan. Species Restoration Center, 357p.
Ko BJ, An J, Seomun H, Lee M, Eo SH. 2018. Microsatellite DNA analysis reveals lower than expected genetic diversity in the threatened leopard cat (Prionailurus bengalensis) in South Korea. Genes & Genomics 40(5):521-530.
[DOI][PubMed]
Kolipakam V, Singh S, Pant B, Qureshi Q, Jhala YV. 2019. Genetic structure of tigers (Panthera tigris tigris) in India and its implications for conservation. Global Ecology and Conservation 20:e00710.
[DOI]
Kolleck J, Yang M, Zinner D, Roos C. 2013. Genetic diversity in endangered Guizhou snub-nosed monkeys (Rhinopithecus brelichi): Contrasting results from microsatellite and mitochondrial DNA data. PLoS ONE 8(8):e73647.
[DOI][PubMed][PMC]
Lee BG, Jeong DH. 2009. Restoration of Asiatic black bears through reintroduction on Mt. Jiri, South Korea. Newsletter of the International Association for Bear Research and Management and IUCN/SSC Bear Specialist Group 18:8-10.
Lee Y, Choi S, An J, Park H, Kim S, Min M, Kim K, Lee H. 2011. Isolation and characterization of 12 microsatellite loci from Korean water deer (Hydropotes inermis argyropus) for population structure analysis in South Korea. Genes & Genomics 33:535-540.
[DOI]
Li YL and Liu JX. 2018. StructureSelector: A web based software to select and visualize the optimal number of clusters using multiple methods. Molecular Ecology Resources 18:176-177.
[DOI][PubMed]
Lim HT, Seo BY, Jung EJ, Yoo CK, Zhong T, Cho IC, Yoon D, Lee JG and Jeon JT. 2009. Establishment of a microsatellite marker set for individual, pork brand and product origin identification in pigs. Journal of Animal Science & Technology 51(3):201-206.
[DOI]
Malenfant RM, Davis CS, Cullingham CI, Coltman DW. 2016. Circumpolar genetic structure and recent gene flow of polar bears: A reanalysis. PLoS ONE 22(3):e0148967.
[DOI][PubMed][PMC]
Menchaca A, Rossi NA, Froidevaux J, Dias-Freedman I, Caragiulo A, Wultsch C, Harmsen B, Foster R, De la Torre JA, Medellin RA, Rabinowitz S, Amato G. 2019. Population genetic structure and habitat connectivity for jaguar (Panther onca) conservation in Central Belize. BMC Genetics 20:100.
[DOI][PubMed][PMC]
Mengulluoglu D, Fickel J, Hofer H, Forster DW. 2019. Non-invasive faecal sampling reveals spatial organization and improves measures of genetic diversity for the conservation assessment of territorial species: Caucasian lynx as a case species. PLoS ONE 14(5):e216549.
[DOI][PubMed][PMC]
Miller SM, Berendorff L, Allen BL, Andrew RL, Ballard G, Ballard JWO, Carins KM, Conroy GC, Fleming PJS, Grueber CE, Oakey J, Smith DA, Stephens D, Wade C, Bishop JM. 2024. Isolation, small population size, and management influence inbreeding and reduced genetic variation in K’gari dingos. Conservation Genetics 25:955-971.
[DOI]
Moore JA, Xu R, Frank K, Draheim H, Scribner KT. 2015. Social network analysis of mating patterns in American black bears (Ursus americanus). Molecular Ecology 24:4010-4022.
[DOI][PubMed]
Muniz L, Perry S, Manson JH, Gilkenson H, Gros-Luis J, Vigilant L. 2010. Male dominance and reproductive success in wild white-faced capuchins (Cebus capuchinus) at Lomas Barbudal, Costa Rica. American Journal of Primatology 72:1118-1130.
[DOI][PubMed][PMC]
Myung CH, Kim TW, Lee SH, Jeong WJ, Yang JJ, Kang HN, Kang HC, Kim JY, Lim HT and Han SH. 2025. Novel microsatellite markers for the identification of the Asiatic black bears being restored in South Korea. Journal of Agriculture & Life Science 59(1):83-89.
[DOI]
Paetkau D, Strobeck C. 1994. Microsatellite analysis of genetic variation in black bear populations. Molecular Ecology 3:489-495.
[DOI][PubMed]
Paetkau D, Waits LP, Clarkson PL, Craighead L, Vyse E, Ward R, Strobeck C. 1998. Variation in genetic diversity across the range of North American brown bears. Conservation Biology 12:418-429.
[DOI]
Parga JA, Sauther ML, Cuozzo FP, Jacky IAY, Lawler RR, Sussman RW, Gould L, Pastorini J. 2016. Paternity in wild ring-tailed lemurs (Lemur catta): implications for male mating strategies. American Journal of Primatology 78:1316-1325.
[DOI][PubMed][PMC]
Park CG, Oh JS, Hong HH. 2017. Study on Evaluation of Genetic Diversity and Management Plan of the Restoring Asiatic Black Bear and Long-tailed Goral. Species Restoration Technology Institute, Korea National Park Service. p.40.
Payseur BA, Jing P and Haasl RJ. 2011. A genomic portrait of human microsatellite variation. Molecular Biology and Evolution 28(1):303-312.
[DOI][PubMed][PMC]
Pritchard JK, Stephens M, Donnelly P. 2000. Inference of population structure using multilocus genotype data. Genetics. 155(2): 945-959.
[DOI][PubMed][PMC]
Pruett CL and Winker K. 2008. The effects of sample size on population genetic diversity estimates in song sparrows Melospiza melodia. Journal of Avian Biology 39:252-256.
[DOI]
Qiao M, Connor T, Shi X, Huang J, Huang Y, Zhang H, Ran J. 2018. Population genetics reveals high connectivity of giant panda populations across human disturbance features in key nature reserve. Ecology and Evolution 2019(9):1809-1819.
[DOI][PubMed][PMC]
Ramirez-Garcia JG, Maciel-Torres SP, Hernandez-Rodriguez MH, Arenas-Baez P, Orzuna-Orzuna JF and Granados-Rivera. 2025. Non-invasive sampling for population genetics of wild terrestrial mammals (2015-2025): A systematic review. Diversity 2025(17):760.
[DOI]
Raymond M and Rousset F. 1995. GENEPOP (Version 1.2): Population genetics software for exact tests and ecumenicism. Journal of Heredity 86(3):248-249.
[DOI]
Robert A, 2009. Captive breeding genetics and reintroduction success. Biological Conservation 142(12):2915-2922.
[DOI]
Rogers LL. 1987. Effects of food supply and kinship on social behavior, movements, and population growth of black bears in northeastern Minnesota. Wildlife Monographs 97:1-72.
Rosenberg NA, Pritchard JK, Weber JL, Cann HM, Kidd KK, Zhivotovsky LA and Feldman MW. 2002. Genetic structure of human populations. Science 298:2381-2385.
[DOI][PubMed]
Ruiz-Garcia M, Wengel PO, Castellanos A, Arias L. 2005. Microsatellite analysis of the Spectacled bear (Trenarctos ornatus) across its range distribution. Genes & Genetic Systems 80:57-60.
[DOI][PubMed]
Saito M, Yamauchi K, Aoi T. 2008. Individual identification of Asiatic black bear using extracted DNA from damaged crops. Ursus 19(2):162-167.
Shimozuru M, Shirane Y, Tsuruga H, Yamanaka M, Nakanishi M, Ishinazaka T, Kasai S, Nose T, Masuda Y, Fujimoto Y, Mano T, Tsubota T. 2019. Incidence of multiple paternity and inbreeding in high-density Brown bear populations on the Shiretoko Peninsula, Hokkaido, Japan. Journal of Heredity 110(3):321-331.
[DOI][PubMed]
Schenk A, Kovacs KM. 1995. Multiple mating between black bears revealed by DNA fingerprinting. Animal Behaviour 50:1483-1490.
[DOI]
Shen F, Zhang Z, He W, Yue B, Zhang A, Zhang L, Hou R, Wang C, Watanabe T. 2009. Microsatellite variability reveals the necessity for genetic input from wild giant pandas (Ailuropoda melanoleuca) into the captive population. Molecular Ecology 18(6):1061-1070.
[DOI][PubMed]
Sinclair EA, Black HL, Crandall KA. 2003. Population structure and paternity in an american black bear (Ursus americanus) population using microsatellite DNA. Western North American Naturalist 63:489-497.
Singh SK, Aspi J, Kvist L, Sharma R, Pandey P, Mishra S, Singh R, Agrawai M, Goyal SP. 2017. Fine-scale population genetic struture of the Bengal tiger (Panthera tigris tigris) in a human-dominated western Terai arc landscape, India. PLoS ONE 12(4):e0174371.
[DOI][PubMed][PMC]
Taberlet P, Camarra JJ, Griffin S, Uhrès E, Hanotte O, Waits LP, Dubois-Paganon C, Burke T, Bouvet J. 1997. Noninvasive genetic tracking of the endangered Pyrenean brown bear population. Molecular Ecology 6(9):869-876.
[DOI][PubMed]
Teng Y, Yang J, Ju LF, Huang WH, Zhang X, Gao FL, Bao WD. 2022. Current genetic structure analysis of leopard cats reveals a weak disparity trend in subpopulations in Beijing, China. Biology 11:478.
[DOI][PubMed][PMC]
Tumendemberel O, Zedrosser A, Proctor MF, Reynolds HV, Adams JR, Sullivan JM, Jacobs SJ, Khorloojav T, Tserenbataa T, Batmunkh M, Swenson JE, Waits LP. 2019. Phylogeography, genetic diversity, and connectivity of brown bear populations in Central Asia. PLoS ONE 14(8):e0220746.
[DOI][PubMed][PMC]
Waples RS, Do C. 2008. LDNE: a program for estimating effective population size from data on linkage disequilibrium. Molecular Ecology Resources 8:753-756.
[DOI][PubMed]
Weber JL and Wong C. 1993. Mutation of human short tandem repeats. Human Molecular Genetics 2:1123-1128.
[DOI][PubMed]
Weeks AR, Stoklosa, Hoffmann AA. 2016. Conservation of genetic uniqueness of populations may increase extinction likehood of endangered species: the case of Australian mammals. Frontiers in Zoology 13:31.
[DOI][PubMed][PMC]
Weir BS and Hill WG. 2002. Estimating F-statistics. Annual Reviews of Genetics 36:721-750.
[DOI][PubMed]
Wu J, Kohno N, Mano S, Fukumoto Y, Tanabe H, Hasegawa M, Yonezawa T. 2015. Phylogeographic and demographic analysis of the Asian black bear (Ursus thibetanus) based on mitodhonrial DNA. PLoS ONE 10(9):e0136398.
[DOI][PubMed][PMC]
Wu J, Yang C, Ma Y, Li Y, Gao W, Kusili Y, Ye L, Yang Y, Xu M, Liao T, Zhong L, Shan W. 2025. Genetic diversity and genetic structure of red deer in the Ebinur Lake Wetland National Nature Reserve. Biodiversity Science 33(12):25233.
[DOI]
Wultsch C, Waits LP, Kelly MJ. 2016. A comparative analysis of genetic diversity and structure in Jaguars (Panthera onca), Pumas (Puma concolor), and Ocelots (Leopardus pardalis) in fragmented landscapes of a critical Mesoamerican linkage zone. PLoS ONE 11(3):e0151043.
[DOI][PubMed][PMC]
Wultsch C, Zeller KA, Welfelt LS, Beausoleil RA. 2023. Genetic diversity, gene flow, and source-sink dynamics of cougars in the Pacific Northwest. Conservation Genetics 24:793-806.
[DOI]
Yamamoto T, Tamatani H, Tanaka J, Kamiile K, Yokoyama S, Koyama M, Kajiwara M. 2013. Multiple paternity in Asian black bear Ursus thibetanus (Ursidae, Carnivora) determined by microsatellite analysis. Mammalia 77:215-217.
[DOI]
Yang J, Shen F, Hou R, Da Y. 2016. Genetic composition of captive panda population. BMC Genetics 17:133.
[DOI][PubMed][PMC]
Yasukoshi Y, Nishida S, Han S, Kurisaki T, Yoneda M, Koike H. 2009. Genetic structure of the Asiatic black bear in Japan using mitochondrial DNA analysis. Journal of Heredity 100(3):297-308.
[DOI][PubMed]
Zeyl E, Aars J, Ehrich D, Bachmann L, Wiig Ø. 2009. The mating system of polar bears: a genetic approach. Canadian Journal of Zoology 87(12):1195-1209.
[DOI]
Zhang W, Lin K, Fu W, Xie J, Fan X, Zhang M, Luo H, Yin Y, Guo Q, Huang H, Chen T, Lin X, Yuan Y, Huang C, Du S. 2024. Insights for the captive management of South China tigers based on a large-scale genetic study. Genes 15:398.
[DOI][PubMed][PMC]
Zhou YL, Wu JJ, Wang ZW, Li GH, Zhou L, Gui JF. 2021. Microsatellite polymorphism and genetic differentiation of different populations screened from genome survey sequencing in red-tail catfish (Hemibagrus wyckioides). Aquaculture Reports 19:100614.
[DOI]
Sang-Hyun Han: https://orcid.org/0000-0002-6615-2811