Journal of Animal Breeding and Genomics (J Anim Breed Genom)
Indexed in KCI
OPEN ACCESS, PEER REVIEWED
pISSN 1226-5543
eISSN 2586-4297
Research Article

Evaluation of inbreeding and founder-based genetic diversity in Hanwoo cows

1Department of Companion Animal Industry, Daegu University, Gyeongsan 38453, Korea
2Korea Animal Improvement Association, Seocho, 06668, Korea
3Department of Animal Biotechnology, Gyeongkuk National University, Yecheon 36830, Korea

Correspondence to Yangmo Koo, E-mail: greatman009@gmail.com; Ji Hong Lee, Email: ghlee2002@korea.kr

Volume 10, Number 1, Pages 1–11, March 2026.
Journal of Animal Breeding and Genomics 2026, 10(1), 1–11. https://doi.org/10.12972/jabng.2026.10.1.1
Received on January 12, 2026, Revised on March 24, 2026 , Accepted on March 24, 2026 , Published on March 31, 2026 .
Copyright © 2026 Korean Society of Animal Breeding and Genetics.
This is an Open Access article distributed under the terms of the Creative Commons Attribution Non-Commercial License (http://creativecommons.org/licenses/by-nc/4.0).

ABSTRACT

This study evaluated inbreeding and the pedigree structure and genetic diversity using pedigree records in Hanwoo cow population. The analysis included 167,422 Hanwoo cows born between 2010 and 2024 that were registered in the national pedigree system. The level of inbreeding increased steadily in recently born animals, and higher inbreeding coefficients were also observed as the pedigree depth increased. In the analysis of pedigree completeness index (PCI) and founder contribution, PCI values tended to increase in recently born animals. Regarding sire usage, the total number of offspring produced, the number of sires used for mating, and the average number of offspring per sire showed a continuous increase over time. The number of effective sires that were frequently used for mating also increased. However, sires ranked within the top 10% for genetic merit accounted for about 60% of the total genetic contribution, indicating that dependence on a small group of high-ranking sires remained at a high level. When major sire contributions were examined, the top five sires together accounted for 4.662% of the total genetic contribution. When the range was extended to the top 20 sires, this value increased to 13.068% in Hanwoo cow population. When the contribution of specific sires remains high within a population, further increases in inbreeding and continuous reduction of genetic diversity can be expected. This may lead not only to changes in growth-related traits, but also to reduced reproductive performance and increased risk of inbreeding depression. Maintaining long-term genetic diversity in Hanwoo cow population may require limiting further accumulation of inbreeding. This could be done by using a wider range of sire and dam lineages in selection, along with efforts to keep the breeding system stable over time.

KEYWORDS

Hanwoo cows, Inbreeding coefficient, Founder contribution, Pedigree completeness index, breeding system

INTRODUCTION

The Hanwoo breeding system has contributed greatly to genetic improvement of economic traits through the selection of proven sires and the widespread use of artificial insemination. However, repeated use of sires from limited lineages at the farm level has led to a gradual narrowing of the genetic base, and continuous increases in inbreeding coefficients within the population have been reported (Cho et al., 2014; Hwang et al., 2009). As inbreeding increases, the proportion of homozygous genotypes also increases, which can negatively affect reproductive performance, growth, and survival ability (Falconer and Mackay, 1996; Essl, 1998). In studies of dairy and beef cattle populations in other countries, accumulation of inbreeding has been associated with reduced production efficiency, lower survival rates, and gradual deterioration of body conformation across generations (González-Recio et al., 2007; McParland et al., 2007; Forutan et al., 2018).

Inbreeding analysis based on pedigree records is strongly dependent on pedigree completeness. When pedigree records contain errors or when the information of pedigree depth differs among generations, the accuracy of estimated inbreeding coefficients may be reduced (Meuwissen and Luo, 1992; Boichard et al., 1997). For this reason, the pedigree completeness index (PCI) has been used as a supplementary indicator to support the interpretation of inbreeding estimates. PCI has been applied in comparisons of pedigree depth among generations and in analyses of founder representation in breeding populations (MacCluer et al., 1983; Cervantes et al., 2011).

At present, the Hanwoo population in Korea has an established environment that allows inbreeding analysis and genetic evaluation based on traceable pedigree. However, studies that systematically evaluate founder-based genetic diversity and sire-specific pedigree structure remain limited. Indicators such as founder gene contribution, founder equivalents, and probability of gene origin are useful for identifying changes in the genetic foundation of a population and for quantifying the concentration and distribution of founders that are strongly connected to specific lineages (Boichard et al., 1997; Leroi et al., 2012). Therefore, this study was conducted to analyze changes in inbreeding and pedigree structure of Hanwoo cows over the past 15 years, to evaluate founder contributions and shifts in genetic diversity, and to assess sire usage patterns. The results are intended to provide basic information that can be used for future breeding and conservation strategies in Hanwoo population.

MATERIALS AND METHODS

Materials

This study used a total of 167,422 Hanwoo cows born between January 1, 2010 and December 31, 2024. Pedigree records registered in the Korean Animal Improvement Association were used for all analyses. To estimate inbreeding more accurately, pedigree files were expanded to include all traceable ancestors of the selected animals. Data quality was checked before analysis. Animals with logical errors in individual, sire, or dam identification were removed. This included cases where offspring were recorded as being born earlier than their parents. Records with incorrect sex information or duplicate registrations were also excluded. Animals with unclear or missing pedigree information were treated as base animals in the pedigree.

Pedigree analysis and data preparation

Because pedigree data has a direct effect on the accuracy of inbreeding estimation, efforts were made to secure the maximum possible pedigree depth. To describe the overall pedigree structure, the pedigree completeness index (PCI) and number of generations were calculated. The maximum number of generations was defined as the most distant traceable ancestor in the pedigree. Complete generations were defined as generations in which all ancestors, such as parents and grandparents, were known. Equivalent generations were calculated as the sum of known ancestors converted into generation units, reflecting the overall amount of pedigree information available for each animal.

Estimation of inbreeding coefficients

The inbreeding coefficient (F) of each animal was estimated based on the path coefficient method originally proposed by Wright (1922). For efficient processing of large-scale pedigree data, the algorithm developed by Meuwissen and Luo (1992) was applied. Inbreeding coefficients were obtained from the diagonal elements of the numerator relationship matrix (A-matrix). The basic definition of the inbreeding coefficient (Fx) follows the standard formula described in previous studies.

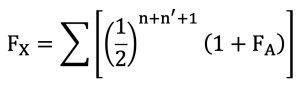
In this context, Fx represents the inbreeding coefficient of individual X, and FA represents the inbreeding coefficient of the common ancestor A. The term n indicates the number of generations from the sire to the common ancestor, while n* indicates the number of generations from the dam to the common ancestor.

The inbreeding coefficient of each individual was calculated based on the genetic relationships among all animals included in the pedigree. Estimation of inbreeding coefficients was performed using the PROC INBREED procedure of the SAS (Statistical Analysis System) package. This procedure estimates covariance between individuals by using information from all known ancestors in the pedigree. The inbreeding coefficient (Fx) of a given individual X is equal to the coancestry coefficient between its parents (S,D). This value is defined as the diagonal element of the numerator relationship matrix for individual X minus one.

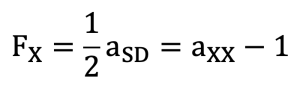
In this definition, aSD represents the additive genetic relationship between the sire (S) and the dam (D), and axx represents the additive genetic relationship between individual X and itself, corresponding to the diagonal element of the relationship matrix.

Pedigree Completeness Index (PCI)

To quantify the availability of pedigree information, the pedigree completeness index (PCI) was calculated for each individual. PCI reflects whether ancestor information is recorded at each generation for a given animal. The index was evaluated by expanding pedigree depth from the first generation (sire and dam) to the second, third, and higher generations. PCI at generation t was defined as follows.

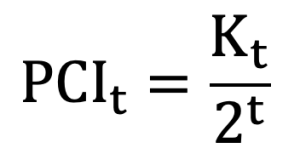
In this definition, Kt represents the number of ancestors that were actually identified at generation t, and 2t represents the total number of ancestors that are theoretically expected at that generation (Boichard et al., 1997; MacCluer et al., 1983). The PCI value for each individual was calculated as the average of PCI values across generations. This approach was used to quantify the reliability of pedigree information for individual animals. In this study, the distribution of individual PCI values was compared across birth periods based on birth year.

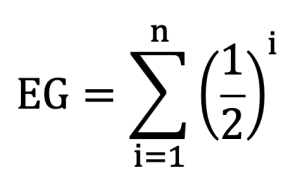
Here, i indicates the generation where parental information was still available for an ancestor. PCI values and related generation indices were used as indicators to verify the completeness of pedigree information. When interpreting the inbreeding coefficient, it was used as a criterion for determining reliability.

Ancestor contribution and founder representation analysis

In order to determine the cause of the increase in the inbreeding, the contribution of common ancestors related to the pedigree was analyzed. In addition, founder genome equivalents and the actual genetic contribution of sires were analyzed. Founders were treated as animals without parental records. Founder contribution was calculated as the genetic contribution rate of individual descendant.

The contribution of each founder f was estimated according to the method described by Boichard et al.(1997).

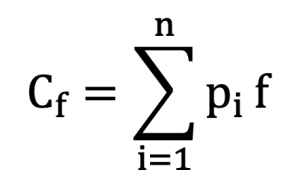
In this equation, pif represents the probability of genetic contribution from founder f to descendant i, and n represents the total number of descendant animals.

Founder genome equivalent (Fge) was calculated using the method proposed by Leroi et al.(2012).

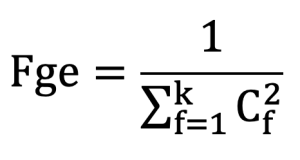
In this definition, k represents the number of founders, and  represents the sum of squared genetic contributions of individual founders.

Population structure analysis and evaluation of mating patterns

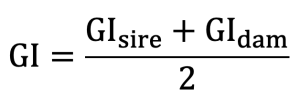
To examine whether changes in inbreeding in Hanwoo cow population were associated with shifts in mating patterns, several population structure indicators were evaluated. These included generation structure, frequency of sires used for mating, distribution of offspring numbers per sire, sex ratio composition, and generation interval (GI) (Dunlop et al., 1993). Generation interval was estimated based on the relationship between parents and offspring. Birth dates of sires and dams were calculated as the average birth date of their offspring, and GI was estimated accordingly.

To further assess repeated use of the same sire, the average number of offspring per sire by year was calculated. In addition, same sire usage bias was evaluated using the proportion of offspring produced by the top 10% of sires.

Statistical analysis and software

Data management, validation, and statistical analyses in this study were conducted using the SAS software package (ver. 9.4). Processing of pedigree data included error detection in the raw data, removal of pedigree linkage errors, and identification of duplicated individuals within the pedigree. These procedures were carried out using the DATA step, PROC SORT, and PROC SQL in SAS. After data cleaning and preparation, the processed pedigree file was analyzed using the PROC INBREED procedure to estimate individual inbreeding coefficients and generation-related information. A Python program was also used for pedigree-based population structure analysis and genetic diversity analysis. The program was run in an Ubuntu Linux environment. Data processing was performed using Pandas and NumPy. The program calculated founder contributions, founder equivalents, pedigree completeness index (PCI), and mating structure by year. Individual founder contribution vectors were analyzed using an iterative recursive procedure based on the algorithm of Meuwissen and Luo (1992) in the large pedigree data.

RESULTS AND DISCUSSION

Inbreeding analysis by birth year

Table 1 presents the results of inbreeding analysis by birth year in Hanwoo cows. For each birth year, the number of inbred individuals, mean of inbreeding coefficient, standard deviation, minimum value, and maximum value were summarized. The number of inbred individuals increased gradually from 92 animals in 2010 to 41,701 animals in 2023, indicating that a larger proportion of recently born animals were affected by inbreeding. The mean of inbreeding coefficient increased from 1.04 in 2010 to 1.88 in 2024, showing an overall upward trend and suggesting higher inbreeding levels in recent birth animals. The standard deviation ranged from 1.32 to 2.50 by birth year. Higher values were observed in 2011 and 2014, with standard deviations between 2.26 and 2.50. Variation by birth year was relatively large. This may be related to the presence of a small number of extreme values. The minimum value was 0.01 in all years. The maximum value differed by year and ranged from 8.60 in 2010 to 38.03 in 2022. The maximum value (38.03%) corresponds to extremely high inbreeding levels, which may result from close inbreeding such as half-sib or more intensive pedigree loops.

The increase of inbreeding by birth year indicates that the proportion of shared common ancestors increased as generations progressed (Falconer and Mackay, 1996). This pattern is consistent with previous studies in Hanwoo populations that reported increasing pedigree concentration of specific lineages (Cho et al., 2014; Hwang et al., 2009). These results are likely related to repeated mating within limited sire lineages at the farm level. Continued accumulation of such mating patterns may accelerate the loss of genetic diversity in the Hanwoo population and suggests that the genetic base of recently born animals has become narrower.

Table 1. Analysis of inbreeding coefficient by birth year in Hanwoo cows.

Birth Year N Mean Std Min Max
2010 92 1.04 1.48 0.01 8.60
2011 183 1.55 2.50 0.01 25.00
2012 453 1.44 2.22 0.01 25.00
2013 656 1.20 1.66 0.01 16.49
2014 1,260 1.29 2.26 0.01 25.39
2015 2,235 1.18 1.68 0.01 25.29
2016 4,034 1.21 1.55 0.01 26.92
2017 5,903 1.11 1.40 0.01 25.44
2018 8,113 1.20 1.45 0.01 25.89
2019 11,028 1.32 1.46 0.01 25.78
2020 16,502 1.44 1.53 0.01 26.07
2021 24,064 1.52 1.41 0.01 27.34
2022 32,708 1.63 1.32 0.01 38.03
2023 41,701 1.77 1.39 0.01 28.54
2024 18,490 1.88 1.38 0.01 26.95

Inbreeding coefficients (F) are expressed in percentage (%)

Inbreeding analysis by pedigree depth

Table 2 summarizes the results of inbreeding analysis by pedigree depth in Hanwoo cows. The mean of inbreeding coefficient was lowest in the first generation, with a value of 0.97, and increased gradually as generation number increased. The highest mean value, 2.13, was observed in the fifteenth generation. These results indicate that the average inbreeding coefficient increased with deeper pedigree generations. The standard deviation remained relatively stable, ranging from 1.14 to 1.54 from the first to the twelfth generation, but showed a decreasing tendency in generations 13 to 15. The highest inbreeding coefficient by generation appeared in the fifth generation, with a value of 38.03.

The accuracy of inbreeding estimates is affected by how much pedigree information is available, and deeper pedigree records tend to give more reliable values. In Korea, pedigree records for sires are centrally managed and usually contain fairly detailed ancestral information. In contrast, pedigree records for cows are often collected at the farm level, and systematic pedigree recording for cows has been emphasized for only about the last 15 years. As a result, pedigree depth for cows is generally lower than that for sires, and differences in pedigree completeness can occur among cow populations. In groups with well-managed pedigree records, deeper pedigree information allows more accurate estimation of individual inbreeding coefficients. In contrast, analyses based on poorly managed pedigree records may produce different or misleading results.

Table 2. Analysis of inbreeding coefficient by pedigree depth in Hanwoo cows.

Pedigree depthNMeanStdMinMax
15420.971.330.0113.33
218,2761.001.440.0125.84
329,4451.361.420.0126.64
434,4091.571.390.0126.95
531,8781.711.410.0138.03
623,4721.791.400.0126.65
714,3571.851.470.0128.54
87,7771.881.540.0126.53
94,1471.891.400.0125.68
101,8561.871.240.0526.39
118141.811.140.0714.12
123211.911.310.0913.81
13961.970.940.576.18
14231.680.610.642.88
15102.130.941.053.66

Inbreeding coefficients (F) are expressed in percentage (%)
Pedigree depth,The number of generations recorded and analyzed in a family tree(pedigree)

Analysis of pedigree completeness index (PCI) and founder contribution

Table 3 shows the proportion of founder gene contributions at each generation by birth year, together with the average pedigree completeness index (PCI) for each year. Founder gene contributions by each generation were back-calculated based on cumulative probabilities of gene contributions across parental generations. The first generation (pci_gen1) represents the most immediate founder generation and can be regarded as the effective base animals. Higher generations (pci_gen2 to pci_gen5) represent indirect contributions transmitted through additional generations from the founders.

The value of pci_gen1 increased from 0.278 in 2010 to 0.974 in 2024. In recent birth years, higher values were observed. Founder contributions from pci_gen3 and higher generations were very small across all years. pci_gen2 showed a more increase in 2023 and 2024. The mean of PCI increased from 0.056 in 2010 to 0.269 in 2024. In recent birth years, higher values were observed. In more recent birth cohorts, pci_gen1 values tended to be higher in the analysis of founder gene contributions, and the average pedigree completeness index (PCI) also went up over time. This pattern may be linked to gradual changes in the pedigree registration system, which seems to have improved the completeness of pedigree records.

Table 3. Pedigree Completeness Index(PCI) and founder contribution by birth year in Hanwoo cows.

Birth_Yearpci_gen1pci_gen2pci_gen3pci_gen4pci_gen5pci_mean
20100.2780.0000.0000.0000.0000.056
20110.3670.0000.0000.0000.0000.073
20120.4800.0030.0000.0000.0000.097
20130.5800.0050.0000.0000.0000.117
20140.6750.0120.0000.0000.0000.137
20150.7180.0180.0000.0000.0000.147
20160.7890.0280.0000.0000.0000.163
20170.8470.0430.0010.0000.0000.178
20180.8770.0610.0020.0000.0000.188
20190.9020.0840.0030.0000.0000.198
20200.9200.1040.0050.0000.0000.206
20210.9350.1290.0080.0000.0000.214
20220.9480.1640.0130.0000.0000.225
20230.9620.2430.0220.0010.0000.246
20240.9740.3320.0370.0020.0000.269

pci_gen1, Proportion of individuals with pedigree information available for at least one generation (parents known); pci_gen2, Proportion of individuals with both parents and grandparents recorded; pci_gen3, Proportion of individuals with three generations of pedigree information; pci_gen4, Proportion of individuals with pedigree records going back four generations; pci_gen5, Proportion of individuals with pedigree records going back five generations; pci_mean, Average pedigree completeness index across generations, reflecting the overall level of pedigree depth and completeness.

Sire usage patterns and reproductive contribution by birth year

Table 4 summarizes sire usage patterns and reproductive contribution by birth year in Hanwoo cows. The table includes the total number of offspring produced, the total number of sires used for mating, the average number of offspring per sire, the effective number of sires frequently used for mating, and the proportion of reproductive contribution from sires ranked within the top 10% for genetic merit. Since 2010, both the total number of offspring and the number of sires used for mating have shown a continuous increase. This trend reflects improvements of pedigree registration as well as an increase in the scale of animals actually involved in reproduction. The average number of offspring per sire increased in recent years. A small number of sires produced a large number of offspring. After 2018, the effective number of sires used for mating also increased. Sire usage patterns appeared a diverse and balanced structure during this period.

But, after 2016, the reproductive contribution of sires ranked within the top 10% for genetic merit has shown a continuous increase and remained above 60%. Despite the increase in the effective number of sires frequently used for mating, mating was still concentrated on a limited group of sires ranked within the top 10% for genetic merit. This can be seen as a result of the selection of specific sires with superior genetic capacity in the process of breeding and reproduction plans at the farm. However, in terms of the genetic diversity, it can be a factor that fixes the structure of disproportionate Hanwoo improvement.

Table 4. Sire usage patterns and reproductive contribution by birth year in Hanwoo cows.

Birth Year Total offspring Unique sires Mean progeny per sire Effective num sires Top 10pct sire contrib
2010 92 36 2.56 17.34 0.37
2011 183 51 3.59 33.52 0.29
2012 453 76 5.96 33.31 0.36
2013 656 88 7.45 27.84 0.46
2014 1260 119 10.59 36.96 0.47
2015 2235 130 17.19 29.17 0.54
2016 4034 164 24.60 18.99 0.66
2017 5903 217 27.20 31.33 0.65
2018 8113 264 30.73 46.00 0.65
2019 11028 320 34.46 60.15 0.62
2020 16502 382 43.20 70.16 0.59
2021 24064 428 56.22 67.85 0.64
2022 32708 448 73.01 91.56 0.59
2023 41701 458 91.05 83.08 0.65
2024 18490 378 48.92 64.25 0.67

Total_offspring, Total number of offspring recorded in the corresponding cohort or year; Unique_sires, Number of distinct sires that contributed offspring within the given period; Mean_progeny_per_sire, Average number of offspring per sire, calculated as total offspring divided by the number of contributing sires; Effective_num_sires, An adjusted sire count representing the genetic balance of sire use, computed as (total_offspring²) / (Σ progeny count² across sires). Higher values indicate more even sire utilization, Top_10pct_sire_contrib, Proportion of total offspring accounted for by the top 10% most prolific sires, used to evaluate sire usage concentration and genetic bias.

Genetic contribution of major sires within the pedigree

Table 5 presents the sires with high genetic contribution within the Hanwoo cow population. The top 20 sires were identified, and their average genetic contributions rates (%) and cumulative genetic contribution rates (%) were summarized. The sire with the highest genetic contribution was individual 227217445, accounting for 1.172% of the average genetic composition of the total population. This was followed by sires 224935161 (1.044%) and 228093006 (0.941%).

The cumulative genetic contribution of the top 20 sires reached 13.068%. In particular, the top five sires alone accounted for a cumulative genetic contribution of 4.662%. These results indicate a strong concentration of genetic contribution driven by the repeated use of semen from a limited number of sires.

This pattern reflects recent trends in Hanwoo farms, where popular sires are preferentially selected for artificial insemination. As a result, offspring derived from specific sire lineages have been produced repeatedly, leading to an expansion of related descendant groups within the population. In general, concentration of genetic contribution in a small number of widely used sires can reduce overall genetic diversity and contribute to an increase in inbreeding levels. Similar genetic bottleneck patterns have been reported in Holstein, Charolais, and Limousin cattle populations (Miglior et al., 2017; Forutan et al., 2018).

Continued reliance on a limited group of sires may lead to a reduction in effective population size (Ne) and fixation of inbred lineages over the long term. Such processes can intensify genetic bottlenecks within the population. Therefore, future sire selection and mating strategies should consider approaches that reduce excessive dependence on specific sire lineages in order to maintain genetic diversity in Hanwoo cow population.

Table 5. Genetic contribution of major sires within the pedigree.

Sire IDqContribution (%)Cumulative (%)
2272174450.0121.1721.172
2249351610.0101.0442.215
2280930060.0090.9413.156
2276018240.0080.7963.952
2276416210.0070.7104.662
2288545850.0070.6985.360
2288554870.0060.6486.007
2277005510.0060.6346.641
2253005780.0060.6147.255
2283507020.0060.6117.866
2252506320.0060.5738.439
2264457370.0060.5548.993
2289244580.0050.5439.536
2261341310.0050.52810.065
2270157830.0050.51710.582
2273277060.0050.51311.095
2259666560.0050.49911.594
2262967640.0050.49712.091
2252505840.0050.49212.583
2293861270.0050.48513.068

q, Represents the proportion of the average genetic contribution of each sire to the evaluated population; Contribution (%), The percentage value of q, indicating the relative genetic contribution of each sire expressed on a percentage scale; Cumulative (%), The cumulative percentage of sire contributions sorted in descending order, indicating the aggregated proportion of genetic influence accounted for by the listed sire.

CONCLUSION

This study analyzed inbreeding changes by birth year and pedigree depth based on pedigree records in Hanwoo cow population. In addition, pedigree completeness index (PCI), founder contribution, sire usage patterns, genetic contributions of major sires were evaluated. The main findings can be summarized as follows. Inbreeding levels increased continuously in recently born animals in Hanwoo cow population. This pattern suggests that genetic diversity has gradually declined due to unbalanced use of sires and repeated selection of closely related lineages during Hanwoo breeding process. Analysis by pedigree depth also showed that inbreeding increased as pedigree generations became deeper. Results for PCI indicated that PCI values increased in recent birth animal. This seems to reflect better pedigree completeness. Looking at sire usage, both the number of offspring and the number of sires used for mating went up over time, and the average number of offspring per sire went up as well. The effective number of sires frequently used for mating also increased. However, sires ranked within the top 10% for genetic merit accounted for approximately 60% of the total reproductive contribution, indicating that dependence on a small group of elite sires remained high. Genetic contribution of major sires showed that the cumulative genetic contribution of the top 20 sires reached 13.068%. In particular, the top five sires alone accounted for a cumulative genetic contribution of 4.662%.

The use of artificial insemination increased over time in Hanwoo cow population. The number of sires involved in breeding also increased. However, mating was still focused on a small number of sires with high genetic merit. This pattern appeared repeatedly in recent years. Such use of the same sires can reduce genetic variation over time. Selection based only on genetic merit does not prevent accumulation of related lines. Repeated mating within similar lineages was observed. Use of different sire lines and regular replacement of sires should be considered in future breeding programs.

In future Hanwoo breeding, mating plans should be adjusted to avoid excessive use of specific sires. Management of sire lineages and genetic merit needs to be balanced. Genetic management at the regional or farm level may also help slow the increase in inbreeding. Combining pedigree-based analysis with genomic inbreeding analysis may provide a more detailed view of population structure and genetic diversity in Hanwoo cows.

CONFLICT OF INTERESTS

No potential conflict of interest relevant to this article is reported.

REFERENCES

Boichard D, Maignel L, Verrier E. 1997. The value of using probabilities of gene origin to measure genetic variability in a population. Genetics Selection Evolution. 29:5-23.
[DOI][PMC]

Cervantes I, Gutiérrez JP, Fernández I, Goyache F. 2011. Estimation of effective population size in small populations: Empirical evaluation. Animal. 5:1662-1670.

Cho CI, Choi TJ, Alam MB, Lee JG, Cho KH, Park BH, Lee SS, Choy YH, Roh SH, Park SB, Choi JG. 2014. The analysis of pedigree structure and inbreeding coefficient in Hanwoo cows. Journal of Agriculture & Life Science. 48(4):187-196. [in Korean]
[DOI]

Dunlop A, Lush J, Smith C. 1993. Generation intervals and genetic change in cattle. Animal Production. 57:13-24.

Essl A. 1998. Longevity in dairy cattle breeding: A review. Livestock Production Science. 57: 79-89.
[DOI]

Falconer DS, Mackay TFC. 1996. Introduction to quantitative genetics, 4th ed. Longman Group. Essex, UK.

Forutan M, Mahyari SA, Baes C, Melzer N, Schenkel FS, Sargolzaei M. 2018. Inbreeding and runs of homozygosity before and after genomic selection in North American Holstein cattle. BMC Genomics. 19:98.
[DOI][PubMed][PMC]

González-Recio O, López de Maturana E, Gutiérrez JP. 2007. Inbreeding depression on female fertility and calving ease in Spanish dairy cattle. Journal of Dairy Science. 90:5744-5752.
[DOI][PubMed]

Hwang JM, Park CJ, Choi JG. 2009. The inbreeding trend of Hanwoo cow population. Annals of Animal Resources Sciences. 20:1-5. [in Korean]

Leroi AM, Bennett MA, Groombridge B. 2012. Founder genome equivalents and conservation strategies. Animal Genetics. 43:539-548.

MacCluer JW, Boyce AJ, Dyke B, Weitkamp LR, Pfenning DW, Parsons CJ. 1983. Inbreeding and pedigree structure in Standardbred horses. Journal of Heredity. 74:394-399.
[DOI][PMC]

McParland S, Kearney JF, Rath M, Berry DP. 2007. Inbreeding effects on milk production, calving performance, fertility, and conformation in Irish Holstein-Friesians. Journal of Dairy Science. 90:4411-4419.
[DOI][PubMed]

Meuwissen THE, Luo Z. 1992. Computing inbreeding coefficients in large populations. Genetics Selection Evolution. 24:305-313.
[DOI][PMC]

Miglior F, Fleming A, Malchiodi F, Brito LF, Martin P, Baes CF. 2017. A 100-year review: Identification and genetic selection of economically important traits in dairy cattle. Journal of Dairy Science. 100:10251-10271.
[DOI][PubMed]

Wright S. 1922. Coefficients of inbreeding and relationship. The American Naturalist. 56:330-338.
[DOI]

Section