
Seong Jun Kim  1,2,† , Subin Jang 1,2,† , Jongan Lee 3 , Haesu Ko 4 , Jaemin Kim 1,2,*
1Division of Applied Life Science (BK21), Gyeongsang National University, Jinju 52828, Republic of Korea
2Institute of Agriculture and Life Sciences, Gyeongsang National University, Jinju 52828, Republic of Korea
3Animal Genetics & Breeding Division, National Institute of Animal Science, Rural Development Administration, Cheonan 31000, Republic of Korea
4Animal Genomics and Bioinformatics Division, National Institute of Animal Science, Rural Development Administration, Wanju 55365, Republic of
Korea
†These authors contributed equally to this work and share first authorship.
*Corresponding author: jmkim85@gnu.ac.kr
Volume 10, Number 3, Pages 173–184, September 2026.
Journal of Animal Breeding and Genomics 2026, 10(3), 173–184. https://doi.org/10.12972/jabng.2026.10.3.7
Received on August 31, 2026, Revised on September 29, 2026, Accepted on September 29, 2026, Published on September 30, 2026.
Copyright © 2026 Korean Society of Animal Breeding and Genetics.
This is an Open Access article distributed under the terms of the Creative Commons Attribution Non-Commercial License (https://creativecommons.org/licenses/by-nc/4.0/) which permits unrestricted non-commercial use, distribution, and reproduction in any medium, provided the original work is properly cited.

DNA methylation, epigenome-wide association study (EWAS), mammalian methylation array
DNA methylation is a chemical modification of DNA that modulates gene activity without altering the underlying genetic sequence (Jones, 2012). As methylation patterns differ across tissues, developmental stages, ages, and disease states, they constitute informative molecular signatures of biological condition (Lokk et al., 2014; Smith et al., 2025). In mammalian genomes, this modification occurs predominantly at CpG sites, rendering CpG methylation a valuable basis for characterizing epigenetic variation among samples and for identifying genomic regions associated with specific traits or phenotypes (Smith and Meissner, 2013; Greenberg and Bourc'his, 2019). DNA methylation can be profiled using sequencing-based approaches, such as whole-genome bisulfite sequencing, or array-based platforms. Although conventional Illumina methylation arrays have been widely employed in human studies, their probes were designed primarily for the human genome, thereby limiting their applicability to other mammalian species. The HorvathMammalMethylChip40 BeadChip (Mammalian Methylation Array) was developed to enable standardized DNA methylation profiling across diverse mammalian species. This array targets approximately 37,000 CpG sites located predominantly in genomic regions that are evolutionarily conserved across mammals, thereby allowing the same platform to be applied across multiple species (Arneson et al., 2022). Such a design facilitates both species-specific and cross-species investigations of DNA methylation in relation to aging, disease, and other complex phenotypes (Arneson et al., 2022; Lu et al., 2023).
As with other array-based methylation platforms, reliable downstream analysis of Mammalian Methylation Array data requires appropriate preprocessing and quality control; raw signal intensities must first be processed to minimize technical variation and unreliable measurements prior to the quantification of methylation levels. Careful preprocessing is particularly critical for obtaining robust and reproducible methylation estimates for subsequent statistical analyses (Triche et al., 2013; Zhou et al., 2018; Arneson et al., 2022). Following preprocessing, methylation profiles can be integrated with phenotypic or clinical information to investigate associations between CpG methylation and traits of interest, with epigenome-wide association studies (EWAS) providing a commonly employed framework for identifying individual CpG sites associated with specific phenotypes while accounting for relevant biological and technical covariates (Michels et al., 2013; Bhat and Jones, 2022). This technical report therefore outlines a practical workflow for Mammalian Methylation Array data, encompassing preprocessing, quality control, normalization, genomic annotation, and EWAS-based identification and interpretation of phenotype-associated CpG sites.
For the example analysis, blood-derived DNA methylation data from 826 domestic dogs and 279 cattle were used. Among the 826 dogs, 84 were from Korea and 742 were from the United States; the Korean canine methylation dataset was obtained from the Gene Expression Omnibus (GEO; accession GSE307447), whereas the methylation datasets for the 742 U.S. dogs and 279 cattle were obtained from GEO accession GSE223748.
For the Korean cohort, whole blood had been collected individually from each dog, and genomic DNA was extracted using the Exgene Blood SV mini kit (GeneAll Biotechnology, Seoul, Republic of Korea) according to the manufacturer's instructions; DNA concentration and purity were assessed using a Qubit fluorometer and a NanoDrop spectrophotometer, and DNA integrity was evaluated by agarose gel electrophoresis prior to methylation profiling. Genome-wide DNA methylation profiling was performed using the HorvathMammalMethylChip40 (Arneson et al., 2022), a custom Illumina Infinium array designed to interrogate CpG sites located predominantly within genomic regions conserved across mammalian species; genomic DNA was subjected to bisulfite conversion and hybridized to the array in accordance with the standard Infinium workflow, and fluorescence intensity measurements obtained following array scanning were stored as raw intensity data (IDAT) files. The publicly available raw IDAT files from these 84 Korean dogs served as the starting point for the preprocessing and quality-control workflow described in this technical report.
The publicly available U.S. dog and cattle methylation data were likewise generated using the HorvathMammalMethylChip40 array. Detailed sample collection and experimental procedures for these cohorts have been described in the original study and are therefore not repeated here (Horvath et al., 2022; Lu et al., 2023). For these datasets, the previously processed β-values provided with the original data were used for downstream analyses, and the raw IDAT files were not reprocessed. Although SeSAMe was reported to have been used for methylation data processing in the original study, the available information was insufficient to determine whether the SHCDPB workflow applied to the Korean dataset, or any additional preprocessing steps, had been employed. These datasets were incorporated for downstream EWAS and comparative analyses.
Raw IDAT files from the 84 Korean dogs were processed in R (version 4.5.3) (Ihaka and Gentleman, 1996) using the SeSAMe package (version 1.28.1; Zhou et al., 2018), which performs signal preprocessing through a series of individual functions specified by a preprocessing code (prep), with the recommended strategy depending on both the array platform and the organism from which the samples were derived. For the Mammal40 platform, HCDPB is recommended for human samples, whereas SHCDPB is recommended for non-human organisms (Table 1); as the present dataset consisted of canine samples profiled using the HorvathMammalMethylChip40 array, the SHCDPB preprocessing workflow was applied accordingly.
Table 1. Recommended SeSAMe preprocessing codes by methylation array platform and sample organism
| Platform | Sample organism | Prep code |
|---|---|---|
| EPICv2/MSA/EPIC/HM450 | Human | QCDPB |
| EPICv2/MSA/EPIC/HM450 | Non-human organism | SQCDPB |
| MM285 | Mouse | TQCDPB |
| MM285 | Non-mouse organism | SQCDPB |
| Mammal40 | Human | HCDPB |
| Mammal40 | Non-human organism | SHCDPB |
| Prep code letters are defined in Table 2. EPIC: Infinium MethylationEPIC BeadChip (v1 and v2); HM450: Infinium | ||
| HumanMethylation450 BeadChip; Mammal40: HorvathMammalMethylChip40 (Mammalian Methylation Array); MM285: | ||
| Infinium Mouse Methylation BeadChip; MSA: Infinium Methylation Screening Array; SeSAMe: SEnsible Step-wise Analysis of | ||
| DNA MEthylation BeadChips. | ||
The SHCDPB workflow comprises 6 sequential preprocessing components: species inference (S), probe-prefix masking (H), Infinium I channel inference (C), nonlinear dye-bias correction (D), detection-based probe masking using p-value with out-of-band array hybridization (pOOBAH; P), and normal-exponential out-of-band (noob) background correction (B), with the corresponding SeSAMe functions and the purpose of each preprocessing step summarized in Table 2. The species-inference step is particularly relevant for Mammal40 data from non- human organisms, as the platform was designed for cross-species applications and thereby requires species-appropriate probe masking prior to subsequent signal processing.
Table 2. SeSAMe preprocessing function codes, corresponding functions, and their respective purposes
| Code | Function | Description |
|---|---|---|
| 0 | resetMask | Reset mask to all FALSE |
| Q | qualityMask | Mask probes of poor design |
| G | prefixMaskButCG | Mask all but cg- probes |
| H | prefixMaskButC | Mask all but cg- and ch-probes |
| C | inferInfiniumIChannel | Infer channel for Infinium-I probes |
| D | dyeBiasNL | Dye bias correction (non-linear) |
| E | dyeBiasL | Dye bias correction (linear) |
| P | pOOBAH | Detection p-value masking using oob |
| I | ELBAR | Mask background-dominated readings |
| B | noob | Background subtraction using oob |
| U | scrub | More aggressive background subtraction using scrub |
| S | inferSpecies | Set species-specific mask |
| T | inferStrain | Set strain-specific mask (mouse) |
| M | matchDesign | Match Inf-I/II in beta distribution |
| cg: CpG probes; ch: CpH (non-CpG) probes; Inf-I/II: Infinium I/II probe design types; noob: normal-exponential out-of-band | ||
| background correction; oob: out-of-band; pOOBAH: p-value with out-of-band array hybridization; SeSAMe: SEnsible Step-wise | ||
| Analysis of DNA MEthylation BeadChips. | ||
The required R packages were first loaded, and SeSAMe annotation resources were cached prior to preprocessing. Paired red- and green- channel IDAT files were then identified for each sample using searchIDATprefixes(), and the identified IDAT pairs were subsequently processed using the SHCDPB workflow through openSesame(), which provides an end-to-end procedure for reading the raw IDAT files, applying the specified preprocessing steps, and extracting CpG-level methylation β-values.
The resulting methylation matrix was organized with CpG probes in rows and individual samples in columns; DNA methylation levels were represented as β-values ranging from approximately 0 to 1, with values closer to 0 indicating lower methylation and values closer to 1 indicating higher methylation. Measurements masked as unreliable during preprocessing were represented as missing values (NA).
Probe detection quality was evaluated using the pOOBAH method, with detection p values calculated following the SHCD preprocessing steps and prior to final detection-based masking and background correction; probe measurements with detection p values greater than 0.05 were considered detection failures. For sample-level quality assessment, the number and proportion of failed probe measurements were calculated for each sample, and samples in which more than 1% of evaluated probes had detection p-values > 0.05 were flagged as potential detection outliers. This criterion was employed as a quality-control indicator rather than as an automatic sample-exclusion rule. In addition, the number and proportion of missing β-values were calculated for each sample to evaluate the extent of probe masking following preprocessing.
The final preprocessing workflow generated 3 principal outputs: (1) an SHCDPB-processed β-value matrix, (2) a pOOBAH detection P-value matrix, and (3) a sample-level quality-control table containing the number and proportion of detection failures and missing β-values. These outputs were exported as tab-delimited text files for subsequent data integration and statistical analyses, with R and package version information additionally recorded using sessionInfo() to facilitate reproducibility. The complete R workflow employed for Mammal40 preprocessing and quality control is provided in Figure 1.
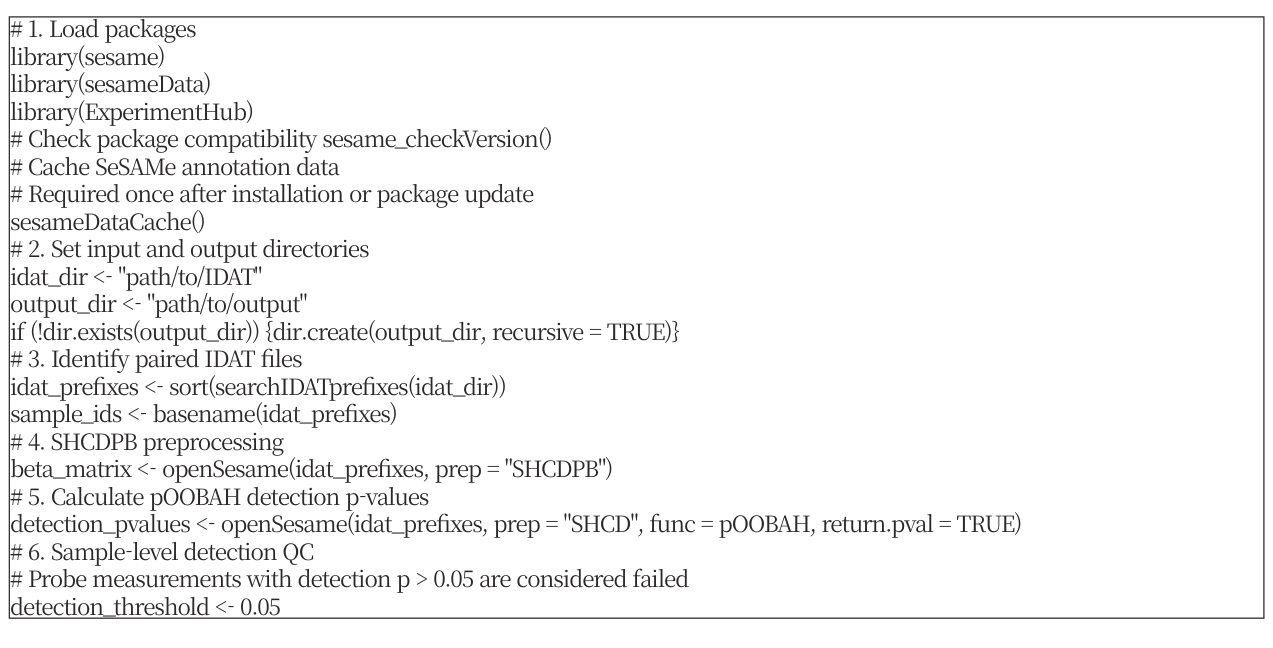
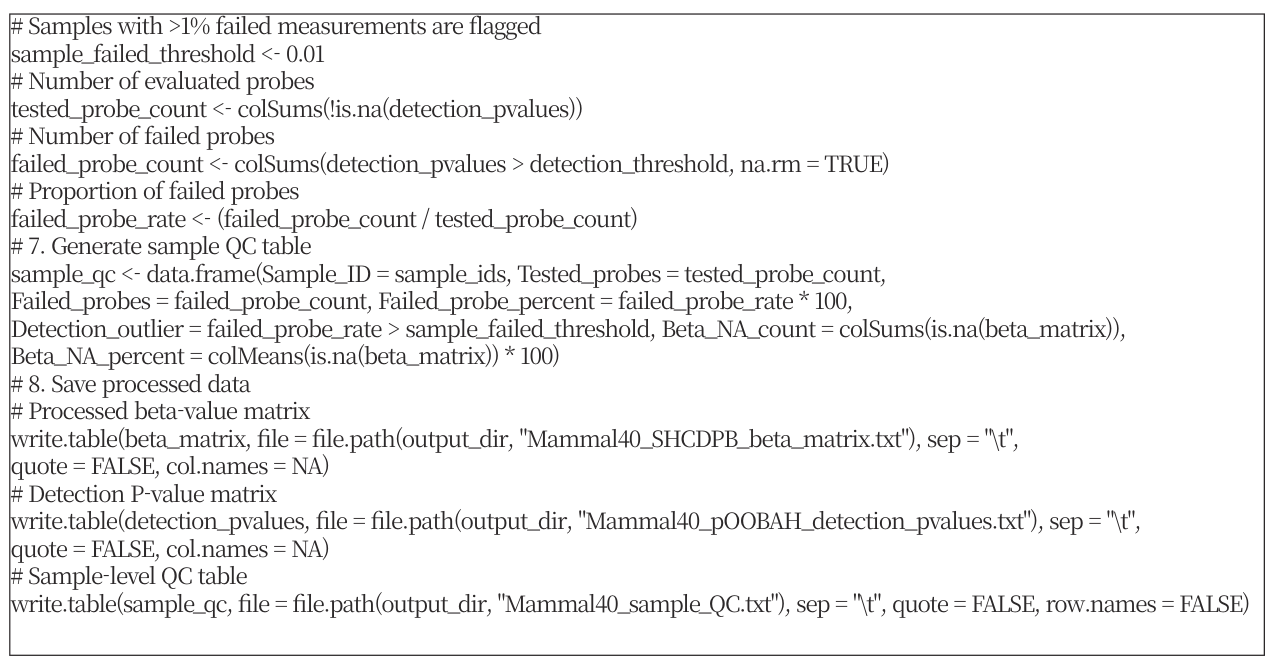
Figure 1. R workflow for preprocessing and quality control of Mammal40 DNA methylation array data using SeSAMe. IDAT: intensity data; Mammal40: HorvathMammalMethylChip40 (Mammalian Methylation Array); NA: not available (missing value); noob: normal-exponential out-of-band background correction; pOOBAH: p-value with out-of-band array hybridization; QC: quality control; SeSAMe: SEnsible Step-wise Analysis of DNA MEthylation BeadChips; SHCDPB: species inference (S), probe-prefix masking (H), Infinium I channel inference (C), nonlinear dye-bias correction (D), pOOBAH masking (P), and noob background correction (B); SHCD: the first four steps of SHCDPB.
The preprocessed methylation matrix described above was used as the input for EWAS analyses, which evaluate the association between DNA methylation levels at individual CpG sites and phenotypic variables of interest while allowing relevant biological or technical covariates to be incorporated into the statistical model. Of the initial 826 dogs, 2 Korean samples identified as outliers during sample-level quality control were excluded from downstream analyses, and one U.S. sample was excluded owing to the absence of sex information, which was required as a covariate in the EWAS models. Consequently, 823 dogs (379 males and 444 females) were retained for the final EWAS.
Several statistical frameworks can be used for EWAS, including limma (linear models for microarray data; Ritchie et al., 2015) and WGCNA (weighted gene co-expression network analysis; Langfelder and Horvath, 2008), with tool selection depending on the analytical objective and study design. In this protocol, limma was chosen because it efficiently performs site-by-site association testing between methylation and phenotypes across hundreds of thousands of CpG sites, provides empirical Bayes shrinkage for improved statistical power with smaller sample sizes, and accommodates complex models with multiple covariates and interaction terms. For each analysis, pairwise comparisons or regression models were conducted based on the experimental design. Consistent definition of comparison direction (e.g., assigning groups in a consistent order) ensures reproducible interpretation of methylation changes across analyses.
EWAS was performed using the limma package (version 3.66.0) in R (version 4.5.3). For dogs (n = 823, multiple breeds), two separate EWAS analyses were conducted: age-associated EWAS and sex-associated EWAS. For cattle (n = 279), age-associated EWAS was performed (Figure 2).
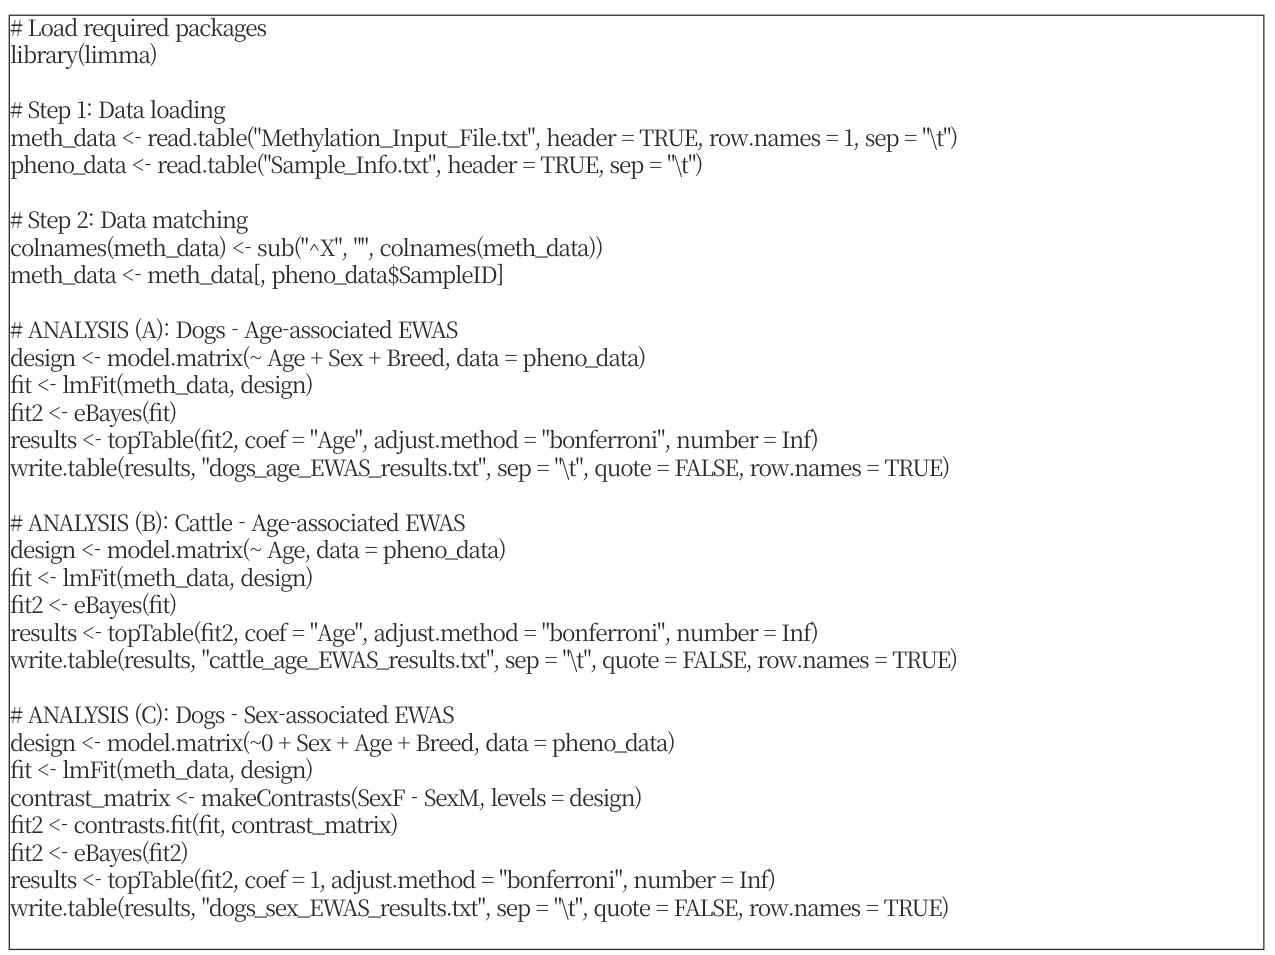
Figure 2. Epigenome-wide association study (EWAS) analysis workflow using limma. (A) Dogs age-associated EWAS with Sex and Breed as covariates. (B) Cattle age-associated EWAS with Age only. (C) Dogs sex-associated EWAS using contrast matrix (Female vs. Male). Each analysis includes lmFit, eBayes, and topTable with Bonferroni correction. EWAS: epigenome-wide association study; limma: linear models for microarray data.
For age-associated EWAS in dogs, the design matrix included age as the primary phenotype of interest with sex and breed included as covariates. Linear regression was performed at each CpG site using the lmFit function, followed by empirical Bayes moderation using the eBayes function. Results were extracted using the topTable function, specifying age (coef = "Age") as the coefficient of interest, and Bonferroni correction was applied for multiple testing.
For age-associated EWAS in cattle, the design matrix included age as the only phenotypic variable, with no additional covariates, as all samples were derived from female individuals. Linear regression, empirical Bayes moderation, and result extraction were performed following the same procedure as in the dog age-associated analysis, with age specified as the coefficient of interest in topTable.
For sex-associated EWAS in dogs, the design matrix was constructed without an intercept term (0 + Sex + Age + Breed), with sex as the primary phenotype of interest and age and breed as covariates. A contrast matrix was created to specify the comparison between sex categories (e.g., Female vs. Male). Following lmFit and eBayes, the contrasts.fit function was used to apply the contrast matrix, and results were extracted using topTable with the contrast coefficient specified.
In this protocol, β-values were used directly as the input for lmFit so that the estimated coefficients could be interpreted as differences in methylation level. Because β-values are bounded between 0 and 1 and can show heteroscedasticity near the extremes, M-values (M = log2[β /(1 − β)]) are often recommended for statistical testing (Du et al., 2010). Users who prefer M-values can apply the same limma workflow after converting the β-value matrix to M-values before lmFit.
For interaction analysis in dogs, an age-by-group interaction assessment was performed to examine whether the association between age and methylation differed between geographic populations (US vs. Korea) (Figure 3). The design matrix included age, group, and their interaction term (Age × Group) as the primary variables of interest, with sex and breed included as covariates. Linear regression was performed using lmFit, followed by empirical Bayes moderation using eBayes. Results were extracted using topTable, specifying the age-by-group interaction coefficient (coef = "Age:GroupUS") to identify CpG sites where methylation changes with age differed between populations.
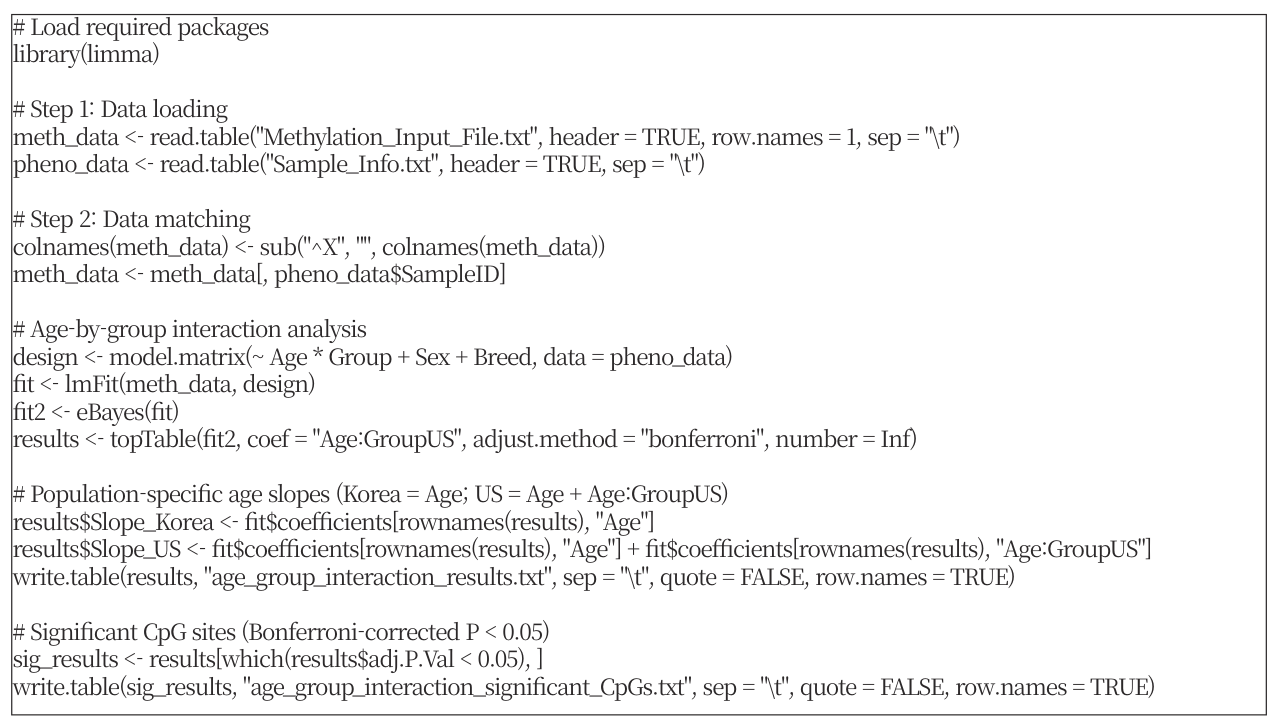
Figure 3. Age-by-group interaction analysis workflow using limma. The design matrix includes Age, Group, and their interaction term (Age × Group) with Sex and Breed as covariates. Each step includes lmFit, eBayes, and topTable with Bonferroni correction to identify CpG sites where methylation changes with age differ between populations (US vs. Korea). EWAS: epigenome-wide association study; limma: linear models for microarray data; US: United States.
As an initial assessment of the processed methylation data, β-value density distributions were examined across the 84 Korean dog samples (Figure 4). Most samples exhibited the characteristic bimodal distribution, with CpG sites concentrated at low and high methylation levels, and their density profiles were broadly similar, indicating consistent methylation distributions across the cohort. However, two samples displayed atypical β-value distributions relative to the remaining samples and were clearly separated from them in hierarchical clustering (Figure 5). On the basis of these concordant quality-control observations, both samples were identified as outliers and excluded from downstream EWAS. In addition, one U.S. dog was excluded owing to missing sex information, which was required as a covariate in the EWAS models. Consequently, 3 dogs were excluded from the initial cohort of 826, yielding a final EWAS cohort of 823 dogs (379 males and 444 females).
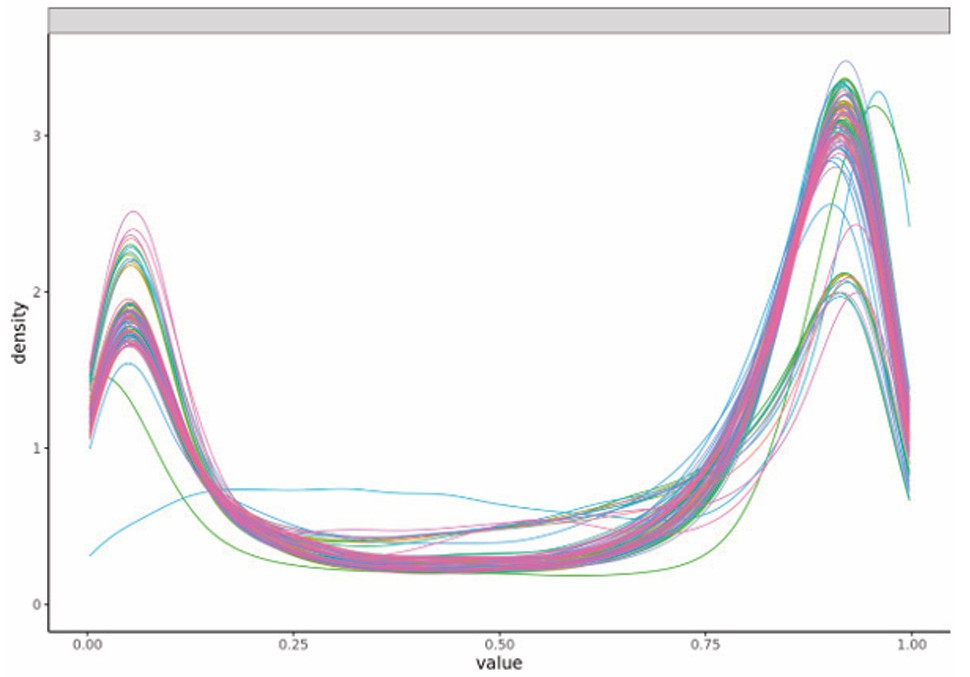
Figure 4. Density distributions of SHCDPB-processed β-values across the 84 Korean dog samples. β-values were obtained following SeSAMe preprocessing with the SHCDPB workflow and range from 0 (unmethylated) to 1 (fully methylated), representing the methylation level at each CpG site. Each colored line represents an individual sample. SeSAMe: SEnsible Step-wise Analysis of DNA MEthylation BeadChips; SHCDPB: species inference (S), probe-prefix masking (H), Infinium I channel inference (C), nonlinear dye-bias correction (D), pOOBAH masking (P), and noob background correction (B).
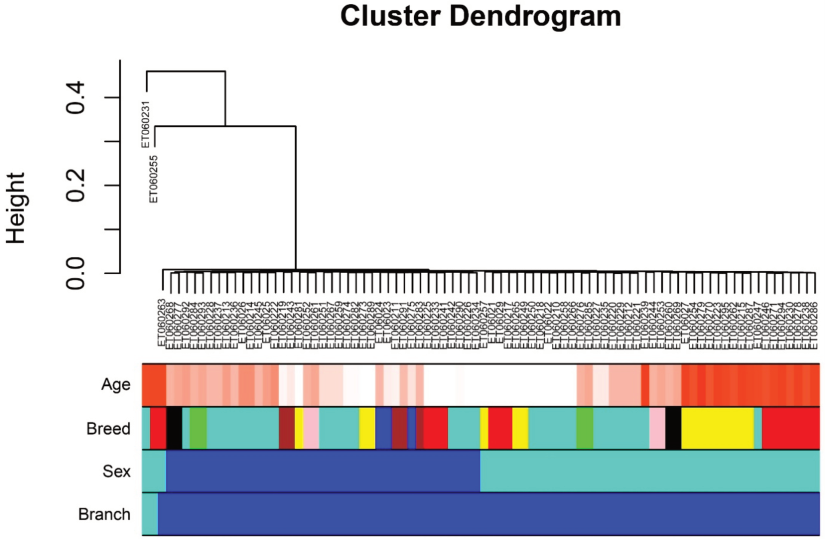
Figure 5. Hierarchical clustering of DNA methylation profiles in the Korean dog cohort. Hierarchical clustering was performed using the processed DNA methylation profiles of 84 Korean dogs. Sample annotations for age, breed, and sex are shown below the dendrogram, together with cluster branch assignment.
The EWAS workflow was applied to methylation array data from dogs (n = 823, multiple breeds) and cattle (n = 279). Of the 38,608 identifiable CpG probes, 37,554 had available β-values in both the dog and cattle datasets and were retained for downstream analysis; this common CpG set was used consistently across the dog age-associated, dog sex-associated, and cattle age-associated EWAS. β-values were used directly as the input for limma to allow straightforward biological interpretation of the estimated coefficients; alternatively, M-values (log2[β /(1 − β)]), which are less affected by heteroscedasticity near the extremes of the methylation range, may be used for statistical testing. For dogs, both age-associated EWAS (age as continuous phenotype with sex and breed as covariates) and sex-associated EWAS (sex as categorical phenotype with age and breed as covariates) were performed. For cattle, age-associated EWAS was performed with age as the only variable, as all samples were derived from female individuals.
For age-associated EWAS in dogs, using Bonferroni correction as the significance threshold, 16,275 CpG sites showed statistically significant associations with age (Figure 6A). For age-associated EWAS in cattle, 20,508 CpG sites exhibited significant associations with age (Figure 6B). For sex-associated EWAS in dogs, 1,702 CpG sites demonstrated significant methylation differences between sexes (Figure 6C). These results represent CpG sites that met the statistical significance criterion and can be used for downstream annotation and functional analysis to identify age-related, sex-related, or species-specific methylation patterns.
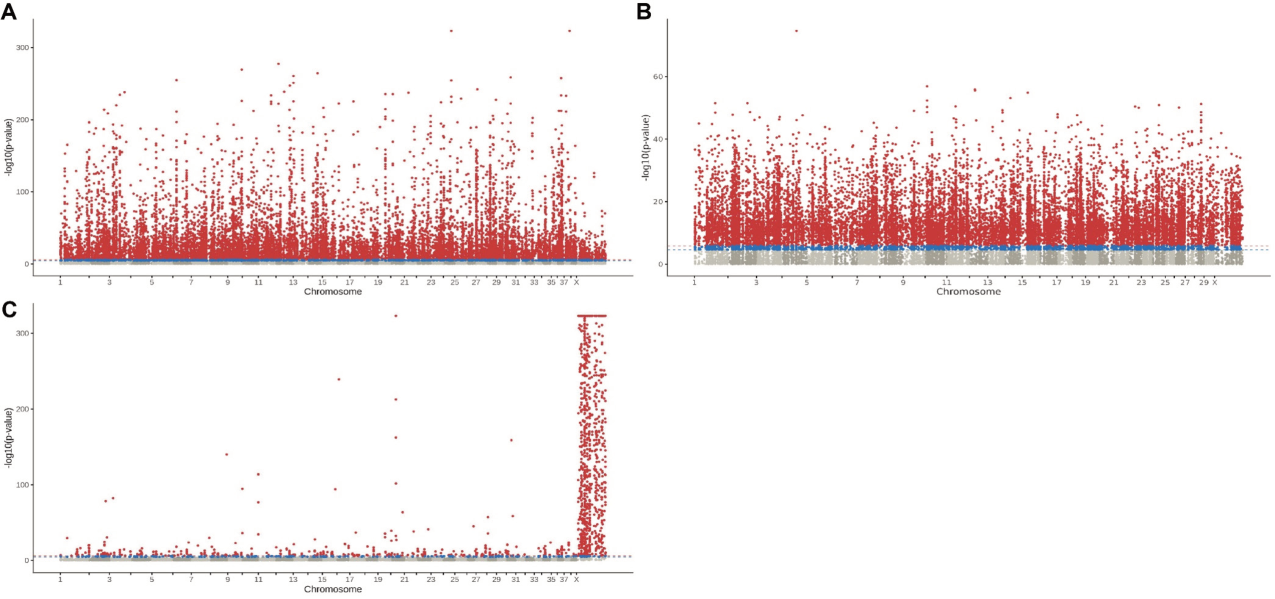
Figure 6. Manhattan plots of EWAS results. (A) Dog age-associated EWAS showing 16,275 significant CpG sites. (B) Cattle age-associated EWAS showing 20,508 significant CpG sites. (C) Dog sex-associated EWAS showing 1,702 significant CpG sites. Red points represent CpG sites meeting the Bonferroni-corrected significance threshold, and blue points represent CpG sites meeting the suggestive threshold (p < 1 × 10⁻⁵), which is shown for visualization only. The x-axis shows chromosomal positions, and the y-axis shows −log10(p). EWAS: epigenome-wide association study.
For the age-by-group interaction analysis in dogs, 230 CpG sites met the Bonferroni-corrected significance threshold. Because the Korean population was set as the reference group, the Age coefficient represents the age-associated methylation slope in the Korean population, whereas the interaction coefficient (Age:GroupUS; logFC) represents how much the slope in the US population differs from that in the Korean population (i.e., US slope = Age + Age:GroupUS). Therefore, the interaction coefficient does not indicate the direction of age-associated methylation change within the US population. Of the 230 significant CpG sites, 212 showed positive interaction coefficients (logFC > 0), indicating a larger age-associated slope in the US population than in the Korean population, while 18 showed negative interaction coefficients (logFC < 0), indicating a smaller age-associated slope in the US population (Figure 7). The population-specific age slopes for all 230 significant CpG sites are provided in Supplementary Table S1. These results identify CpG sites where the rate of age-associated methylation change differs between geographic populations (US vs. Korea). However, because geographic group was confounded with data source in the present datasets, dataset-specific technical effects could not be separated from true geographic differences. Therefore, the Korea–US comparison should be interpreted with caution, as the observed differences may partly reflect technical variation between the datasets.
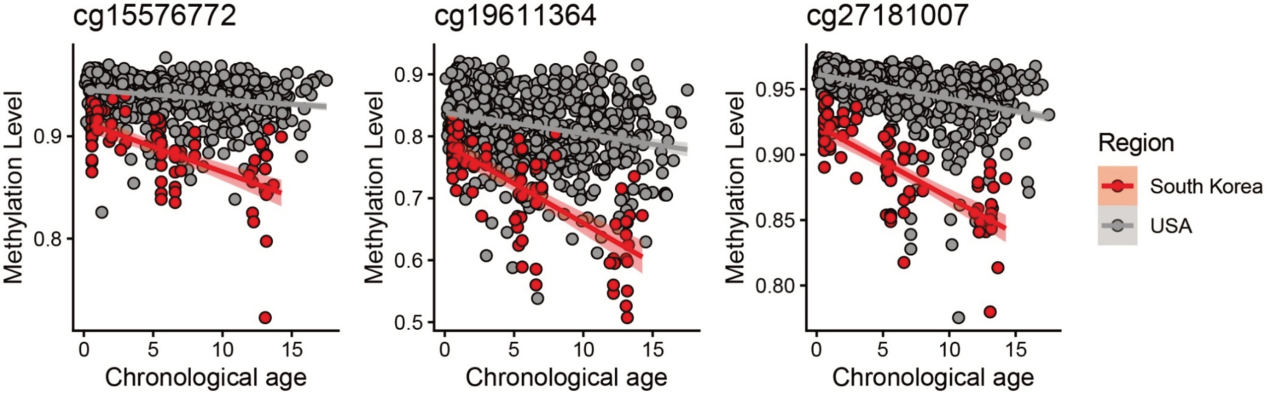
Figure 7. Representative CpG sites from age-by-group interaction analysis. Scatter plots show methylation levels versus chronological age for 3 CpG sites (cg15576772, cg19611364, cg27181007) with significant age-by-group interaction (Bonferroni-corrected p < 0.05). Red circles represent South Korea population; gray circles represent US population. US: United States.
The identified significant CpG sites from all analyses can be further classified by direction of methylation change and mapped to genomic features such as promoters, gene bodies, and regulatory regions for functional interpretation. Additionally, these CpG sites can be used for downstream analyses including genomic annotation, overlap-based comparison across populations or phenotypes, identification of methylation- associated genes, and functional enrichment analysis. The number of CpGs retained for analysis may vary across species and datasets, depending on species-specific probe applicability and the preprocessing or masking procedures applied. The number of significant CpGs identified should be interpreted in light of several factors, including the filtering thresholds applied, the number or proportion of successfully measured CpG probes, sample size, the direction of group assignment, and the significance criterion employed.
This technical protocol provides a practical workflow for Mammalian Methylation Array analysis, encompassing SeSAMe-based preprocessing and quality control of raw IDAT files, CpG-level methylation quantification, and EWAS using limma. By integrating β-value matrices with phenotypic information, this workflow enables the identification of CpG sites associated with continuous or categorical traits, as well as the evaluation of interaction effects between populations.
The practice examples using canine and bovine methylation datasets demonstrate the application of this workflow to age-, sex-, and population-associated methylation analyses. Significant CpG sites identified through these analyses can provide a basis for downstream genomic annotation, comparison across phenotypes or populations, identification of methylation-associated genes, and functional enrichment analysis.
Not applicable.
Conceptualization: Kim SJ, Jang S, Kim J. Data curation: Kim SJ, Jang S, Lee J, Ko H. Formal analysis: Kim SJ, Jang S. Methodology: Kim SJ, Jang S, Kim J. Resources: Lee J, Ko H. Software: Kim SJ, Jang S. Visualization: Kim SJ, Jang S. Writing – original draft: Kim SJ, Jang S. Writing – review & editing: Lee J, Ko H, Kim J. Supervision: Kim J. Funding acquisition: Kim J. All authors read and approved the final manuscript.
No potential conflict of interest relevant to this article is reported.
This study was approved by the Institutional Animal Care and Use Committee (IACUC) of the National Institute of Animal Science (NIAS), Korea (approval code: NIAS 2022-586). All animal procedures were conducted in accordance with the NIAS Guidelines for the Care and Use of Laboratory Animals and complied with the ethical standards set by the committee.
This study was supported by a grant from the Cooperative Research Program for Agriculture Science & Technology Development (Project no. RS-2023-00231792), National Institute of Animal Science, Rural Development Administration, Republic of Korea.
The following supplementary materials are available on the journal's website:
Table S1. Age-associated methylation slopes in Korean and U.S. dogs for the 230 CpGs showing significant age-by-group interaction effects (Bonferroni-corrected p < 0.05).
During the preparation of this work, the authors used ChatGPT and Claude to improve language and readability; following use of this tool, the authors reviewed and edited the content as necessary and take full responsibility for the content of this publication.
Arneson A, Haghani A, Thompson MJ, et al. 2022. A mammalian methylation array for profiling methylation levels at conserved sequences. Nature Communications 13:783. https://doi.org/10.1038/s41467-022-28355-z
Bhat B, Jones GT. 2022. Data analysis of DNA methylation epigenome-wide association studies (EWAS): A guide to the principles of best practice. In: Horsfield J, Marsman J, editors. Chromatin: Methods and protocols. Methods in molecular biology, Vol. 2458. Humana. pp. 23–45. https://do i.org/10.1007/978-1-0716-2140-0_2
Du P, Zhang X, Huang CC, et al. 2010. Comparison of Beta-value and M-value methods for quantifying methylation levels by microarray analysis. BMC Bioinformatics 11:587. https://doi.org/10.1186/1471-2105-11-587
Greenberg MVC, Bourc'his D. 2019. The diverse roles of DNA methylation in mammalian development and disease. Nature Reviews Molecular Cell Biology 20:590–607. https://doi.org/10.1038/s41580-019-0159-6
Horvath S, Lu AT, Haghani A, et al. 2022. DNA methylation clocks for dogs and humans. Proceedings of the National Academy of Sciences of the United States of America 119:e2120887119. https://doi.org/10.1073/pnas.2120887119
Ihaka R, Gentleman R. 1996. R: A language for data analysis and graphics. Journal of Computational and Graphical Statistics 5:299–314. https://doi .org/10.1080/10618600.1996.10474713
Jones PA. 2012. Functions of DNA methylation: Islands, start sites, gene bodies and beyond. Nature Reviews Genetics 13:484–492. https:// doi.org/10.1038/nrg3230
Langfelder P, Horvath S. 2008. WGCNA: An R package for weighted correlation network analysis. BMC Bioinformatics 9:559. https:// doi.org/10.1186/1471-2105-9-559
Lokk K, Modhukur V, Rajashekar B, et al. 2014. DNA methylome profiling of human tissues identifies global and tissue-specific methylation patterns. Genome Biology 15:3248. https://doi.org/10.1186/gb-2014-15-4-r54
Lu AT, Fei Z, Haghani A, et al. 2023. Universal DNA methylation age across mammalian tissues. Nature Aging 3:1144–1166. https://doi.org/10.103 8/s43587-023-00462-6
Michels KB, Binder AM, Dedeurwaerder S, et al. 2013. Recommendations for the design and analysis of epigenome-wide association studies. Nature Methods 10:949–955. https://doi.org/10.1038/nmeth.2632
Ritchie ME, Phipson B, Wu D, et al. 2015. limma powers differential expression analyses for RNA-sequencing and microarray studies. Nucleic Acids Research 43:e47. https://doi.org/10.1093/nar/gkv007
Smith ZD, Meissner A. 2013. DNA methylation: Roles in mammalian development. Nature Reviews Genetics 14:204–220. https://doi.org/10.1038/ nrg3354
Smith ZD, Hetzel S, Meissner A. 2025. DNA methylation in mammalian development and disease. Nature Reviews Genetics 26:7–30. https://doi.or g/10.1038/s41576-024-00760-8
Triche TJ Jr, Weisenberger DJ, Van Den Berg D, et al. 2013. Low-level processing of Illumina Infinium DNA methylation BeadArrays. Nucleic Acids Research 41:e90. https://doi.org/10.1093/nar/gkt090
Zhou W, Triche TJ Jr, Laird PW, et al. 2018. SeSAMe: Reducing artifactual detection of DNA methylation by Infinium BeadChips in genomic deletions. Nucleic Acids Research 46:e123. https://doi.org/10.1093/nar/gky691