Gwangtaek Lim  , Yoonjae Han , Yeonho Kim , Deukmin Lee *
Department of Animal Life Convergence Science, Hankyong National University, Anseong 17579, Republic of Korea
*Corresponding author: dhlee@hknu.ac.kr
Volume 10, Number 3, Pages 107–117, September 2026.
Journal of Animal Breeding and Genomics 2026, 10(3), 107–117. https://doi.org/10.12972/jabng.2026.10.3.2
Received on August 27, 2026, Revised on September 22, 2026, Accepted on September 23, 2026, Published on September 30, 2026.
Copyright © 2026 Korean Society of Animal Breeding and Genetics.
This is an Open Access article distributed under the terms of the Creative Commons Attribution Non-Commercial License (https://creativecommons.org/licenses/by-nc/4.0/) which permits unrestricted non-commercial use, distribution, and reproduction in any medium, provided the original work is properly cited.

genomic sex verification, pseudoautosomal region, single nucleotide polymorphism (SNP) quality control, Wahlund effect, X chromosome inbreeding coefficient
In pig breeding populations, genotype records must be linked correctly to animals, pedigrees, and performance records before genomic information is used for selection. A mismatch involving a breeding candidate can compromise the interpretation of its own records and its links to relatives. Sex is a routinely recorded attribute that can provide a practical consistency check when genomic data are received. Disagreement between recorded sex and genomic evidence may indicate a recording or sample-handling error, contamination, a genotype-calling artifact, or a biological condition involving the sex chromosomes. Genomic sex verification is therefore an important component of livestock genotype quality control (McClure et al., 2018; Bilton et al., 2019; Ryan et al., 2024). In a breeding population with selected lines and many relatives, the usefulness of this check depends on how the reference population and validation groups are defined. Typical males carry 1 copy of most of the X chromosome and should show little true heterozygosity in that region, whereas females carry 2 copies and may be heterozygous. Markers in the pseudoautosomal region (PAR) are excluded because the region is shared by the X and Y chromosomes and can appear heterozygous in males. The non-PAR X chromosome inbreeding coefficient, FX, compares an animal’s observed heterozygosity with that expected from a defined reference population. Values close to 1 are expected in typical males, whereas females generally have lower values.
The numerical scale of FX depends on the marker panel and the allele frequencies used to calculate expected heterozygosity. Pooling genetically differentiated breeds can increase expected heterozygosity relative to the average within breeds and can consequently elevate individual FX. This Wahlund effect can be confused with individual inbreeding if the reference population is defined too broadly (Wahlund, 1928; Wright, 1951; Overall and Nichols, 2001). Duroc, Landrace, and Yorkshire have distinct selection histories and genomic backgrounds (Grossi et al., 2017; Tang et al., 2020). The distinctive aim of this study was to separate reference-population effects from marker-panel effects in a large commercial breeding dataset and to assess whether strong agreement with recorded sex persisted when validation accounted for shared parents or farm. We compared pooled and breed-specific cutoffs, recalculated female scores using breed-specific frequencies on an identical single nucleotide polymorphism (SNP) panel, and evaluated repeated and grouped validation. The objective was to establish evidence for population-specific calibration, rather than to propose a universal sex-determination threshold.
The starting dataset comprised 11,502 genotype records assigned to 10,378 animal identifiers from a commercial great-grandparent population of Duroc, Landrace, and Yorkshire pigs. The records accumulated between July 22 2019 and January 14 2026. All animals were genotyped using the GeneSeek Genomic Profiler Porcine HD array (GGP Porcine HD; Neogen GeneSeek), which contained 75,202 SNP markers positioned on the Sscrofa11.1 reference assembly (Warr et al., 2020). Animal identifier, breed, recorded sex, parent identifiers, birth date, and farm were obtained from the breeding database. Recorded sex was used as the comparison label but was not independently confirmed for this study. Therefore, disagreement between genomic classification and recorded sex was interpreted as requiring further investigation rather than as a confirmed recording error.
Of the 11,502 genotype records, 1,124 were additional records for identifiers already represented in the data. Retaining the record with the greatest number of called genotypes for each identifier left 10,378 identifiers. Four pairs carrying different identifiers met a duplicate criterion of at least 99.5% SNP genotype concordance, with observed concordance from 99.97% to 100.00%. An existing review of genotype identity, Mendelian consistency, and array-wide sample call rate designated 1 identifier from each pair for exclusion, leaving 10,374 identifiers. The genomQC software generated the array-wide sample call-rate and autosomal-heterozygosity indicators used for technical sample filtering (Lee, 2026). Two animals with an array-wide sample call rate below 0.75 were excluded. Four animals with heterozygosity more than 4.0 standard deviations below or above the reference mean on a predefined panel of 9,768 autosomal SNPs were also excluded. The final dataset contained 10,368 pigs: 2,996 Duroc, 3,537 Landrace, and 3,835 Yorkshire. It comprised 4,782 recorded females and 5,586 recorded males.
The array included 2,987 X chromosome loci. Das et al. (2013) mapped the porcine PAR boundary to X:6,743,567 bp on Sscrofa10.2. To transfer this boundary to Sscrofa11.1, we aligned a boundary-centered 401-bp RefSeq sequence to that assembly. Its only exact match placed the boundary at X:6,392,210 bp. Removing 96 PAR markers left 2,891 non-PAR candidates. Marker statistics were calculated in recorded females because they provide a diploid X chromosome reference. Markers with a call rate below 0.95 among recorded females were removed, followed by markers with a female minor allele frequency below 0.01. These filters removed 234 and 272 markers, respectively, and retained 2,385 SNPs. Hardy–Weinberg equilibrium was not used because a test across differentiated breeds could preferentially remove markers reflecting the population structure examined here.
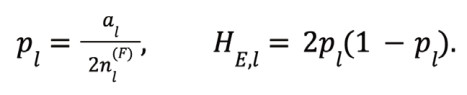
For marker l, alternative-allele frequency and expected heterozygosity in the pooled female reference were calculated as
(1)
where al was the number of alternative alleles among recorded females and nl(F) was the number of females with a nonmissing genotype. Mean expected heterozygosity over the L = 2, 385 retained markers was
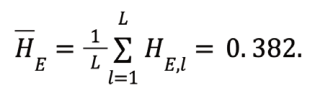
(2)
For animal i, observed heterozygosity and the X chromosome score were
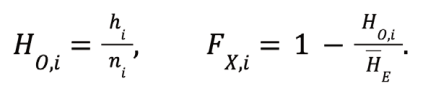
(3)
where hi and ni were the numbers of heterozygous and called genotypes on the retained panel. Missing genotypes were omitted from these individual counts, whereas remained fixed over all retained markers. This fixed panel denominator placed all animals on a common score  scale and differed from recalculating expected heterozygosity over the loci called in each animal. In recorded males, FX was interpreted as a sex-verification score rather than as conventional individual inbreeding.
Recorded males were the positive class. Sensitivity was the proportion of recorded males classified as male, specificity was the proportion of recorded females classified as female, and overall agreement was the proportion matching recorded sex. These are record-based measures, not diagnostic sensitivity, specificity, or accuracy against independently established biological sex. The area under the receiver operating characteristic curve (AUC) measured how consistently FX ranked recorded males above recorded females across possible cutoffs. Its nominal 95% confidence interval in the original analysis was calculated by the DeLong method (DeLong et al., 1988). The cutoff maximized the Youden index (Youden, 1950),

(4)
An animal with FX at or above the cutoff was classified as male by the score. If multiple finite cutoffs attained the maximum Youden index, the smallest was selected. Nominal 95% confidence intervals for sensitivity, specificity, and agreement in Table 1 were calculated with the Wilson score method (Wilson, 1927). These intervals assume independent animals.
The original 5-fold analysis randomly assigned animals while approximately maintaining breed-by-recorded-sex proportions. In each split, recorded training females alone supplied marker quality control (QC), allele frequencies, and the fixed panel-mean expected heterozygosity. All training animals then supplied 1 cutoff across breeds and separate within-breed cutoffs. The held-out animals were scored and classified using these training estimates without refitting. Both cutoff strategies used the same held-out scores. Each animal contributed 1 out-of-fold prediction per complete 5-fold partition. AUC calculated from the combined out-of-fold scores is an internal summary; fold-specific AUCs were also retained because reference scales can differ between folds.
To assess variation across random partitions and account for dependence among related animals, we performed random, sire-grouped, and dam-grouped 5-fold cross-validation, each repeated 10 times. In sire-grouped and dam-grouped validation, animals sharing the same recorded sire or dam, respectively, were assigned to the same fold. The dataset contained 780 recorded sires and 3,339 recorded dams without missing parent identifiers. Breed-by-recorded-sex strata were used to seek balanced group allocation; exact balance was not imposed. Leave-one-farm-out validation held out each of the 2 farms in turn. These designs reflect the need to consider data structure when selecting validation partitions (Roberts et al., 2017). Marker QC, the female frequency reference, and cutoffs were re-estimated solely within training data in every split. Reported repeated-validation ranges describe variation across partitions, not confidence intervals. Within-breed cutoffs were not summarized for farm-held-out validation because the training set contained no Duroc when the farm containing all Duroc was held out.
As a secondary analysis, we restricted the data to animals with successful genotype calls at 1,789 or more of the 2,385 non-PAR X markers, corresponding to an individual X-panel call rate of at least 0.75. This practical threshold was not estimated from the observed data. We first evaluated the restricted subset without changing the marker panel, pooled female reference, previously calculated FX values, or cutoff. We then re-estimated only the cutoff within that subset. The individual X-panel call rate was distinct from the array-wide sample call rate used for animal eligibility. It was also distinct from the per-marker call rate among recorded females used for SNP selection. The threshold was used only to define the secondary subset and did not affect the main analysis of 10,368 animals.
To isolate the reference-frequency effect, the primary population-reference comparison retained the identical 2,385 SNPs selected in pooled recorded females. For each breed, allele frequencies and the unweighted panel mean of 2p(1−p) were recalculated using only recorded females of that breed, without further call-rate or minor-allele-frequency filtering. Thus, each animal retained the same called loci, heterozygote count, and observed heterozygosity; only the expected-heterozygosity denominator changed. Markers monomorphic within a breed were retained with expected heterozygosity zero. All retained markers had genotype calls in females of each breed. This was a descriptive reference comparison within the dataset, not an independent prediction analysis. The earlier analysis that repeated both marker QC and frequency estimation within breed was retained as a secondary comparison in the Results. Pooled-reference female scores were compared among breeds using the Kruskal–Wallis test (Kruskal and Wallis, 1952).
Population heterozygosity was calculated from recorded females on the common panel of L = 2,385 markers. For marker l,

(5)
Here, B = 3. At marker l in breed b, hl,b was the number of heterozygous females, nl,b(F) was the number of females with a nonmissing genotype, and pl,b was the female alternative-allele frequency. The weight wl,b was the proportion of all called females contributed by breed b, and the pooled female frequency pl was defined in Eq. (1). Overall HO, HS, and HT were the unweighted means of their corresponding marker-specific values across the 2,385 markers.
These panel means were used to calculate descriptive fixation indices following Wright (1951):

(6)
These ratios describe population-level variation among recorded females on the selected non-PAR X panel. They are not estimates of individual inbreeding or genome-wide population differentiation.
Study-specific analyses used Python 3.12.1 (Python Software Foundation, 2023). The revision analyses used NumPy 2.4.6, pandas 2.2.3, SciPy 1.15.2, scikit-learn 1.6.1, and Matplotlib 3.10.9. The workflow verified eligibility using genomQC indicators and performed marker selection, FX calculation, reference comparisons, and validation. Analysis scripts, retained-marker lists, and fold-level results are available from the corresponding author upon reasonable request. Individual genotype and breeding records require permission from the commercial data provider. This retrospective study used routine breeding records and involved no new animal handling.
Mean FX was 0.227 in recorded females and 0.992 in recorded males (Figure 1). Analysis of all 10,368 animals produced an AUC of 0.997. At the cutoff of 0.883 estimated across breeds, record-based sensitivity was 99.57%, specificity was 99.67%, and agreement was 99.61%. Classification differed from recorded sex for 40 animals: 24 recorded males below the cutoff and 16 recorded females at or above it. These 40 animals cannot be classified as confirmed recording errors or biological sex misclassifications without independent evidence.
The original random 5-fold partition produced an AUC of 0.997 and agreement of 99.60% with cutoffs estimated across breeds (41 disagreements), compared with 99.59% using within-breed cutoffs (42 disagreements; Table 1). Across 10 additional random partitions, mean agreement was 99.59% (range, 99.58–99.60%) for the across-breed strategy. Across 10 sire-grouped partitions, mean AUC was 0.9967 (range, 0.9967–0.9968) and mean agreement was 99.59% (range, 99.58–99.60%; 41–44 disagreements). Across 10 dam-grouped partitions, mean AUC was 0.9968 (range, 0.9967–0.9968) and mean agreement was 99.59% (range, 99.57–99.60%; 41–45 disagreements). Leave-one-farm-out validation gave combined AUC 0.9968 and agreement 99.60% (41 disagreements). Agreement was 99.84% when farm DY was held out and 99.48% when farm TA was held out. All Duroc animals occurred at TA; therefore, this comparison combines farm and breed differences and is not a clean estimate of farm effects (Table 2).
In repeated sire-grouped validation, mean agreement with within-breed cutoffs was 99.57% (range, 99.52–99.59%), compared with 99.59% for cutoffs estimated across breeds. Repeated dam-grouped validation gave corresponding means of 99.5843% and 99.5882%, whereas repeated random validation showed a small descriptive difference in the other direction (99.5939% versus 99.5882%). Thus, breed-specific cutoffs did not provide a consistent improvement, and no significance claim was made. These analyses support internal robustness under the tested partitions, without establishing external transferability.
The 40 all-animal disagreements comprised 26 Duroc (12 recorded females, 14 recorded males), 6 Landrace (3 females, 3 males), and 8 Yorkshire (1 female, 7 males). Supplementary Table S1 reports each animal’s score, predicted and recorded sex, X-panel called and
Table 1. Performance of non‑PAR FX in the all‑animal analysis and 5‑fold cross‑validation (n=10,368)
| Metric | All‑animal analysis Five‑fold validation, cutoff across breeds Five‑fold validation, cutoff within breed | ||
|---|---|---|---|
| AUC (95% CI) | 0.997 (0.995–0.998) | 0.997 (0.995–0.998) | 0.997 (0.995–0.998) |
| Sensitivity, % (95% CI) | 99.57 (99.36–99.71) | 99.55 (99.34–99.70) | 99.59 (99.38–99.73) |
| Specificity, % (95% CI) 99.67 (99.46–99.79) | 99.67 (99.46–99.79) | 99.60 (99.38–99.75) | |
| Agreement, % (95% CI) 99.61 (99.48–99.72) | 99.60 (99.46–99.71) | 99.59 (99.45–99.70) | |
| Disagreements (n) | 40 | 41 | 42 |
| PAR: pseudoautosomal region; FX: non-PAR X chromosome inbreeding coefficient; AUC: area under the receiver operating | |||
| characteristic curve; CI: nominal confidence interval assuming independent animals. | |||
| All metrics use recorded sex as the comparison label. The 2 validation columns describe the original random partition. | |||
| Repeated and grouped validation results are provided in Table 2. | |||
Table 2. Record‑based sex‑verification performance across repeated random, sire‑grouped, and dam‑grouped 5‑fold cross‑validation in 10 replicates and 2‑fold leave‑one‑farm‑out validation in real data.
| Validation design | AUC, mean (range) | Agreement %, mean (range) | Disagreements |
|---|---|---|---|
| Random | 0.997 (0.997–0.997) | 99.588 (99.576–99.605) | 41–44 |
| Sire‑grouped | 0.997 (0.997–0.997) | 99.593 (99.576–99.605) | 41–44 |
| Dam‑grouped | 0.997 (0.997–0.997) | 99.588 (99.566–99.605) | 41–45 |
| Farm holdout | 0.997 | 99.605 | 41 |
| AUC: area under the receiver operating characteristic curve. | |||
| Recorded males were the positive class. Values use across‑breed cutoffs. Each repeated partition evaluates the same 10,368 | |||
| animals once; ranges are minima–maxima across 10 partitions, not confidence intervals. Farm holdout is the combined 2‑fold | |||
| result. | |||
heterozygous counts, X-panel call rate, and array-wide call rate. Their X-panel call rates ranged from 0.647 to 1.000 (median, 0.997); 1 was below 0.75. Recording errors, sample mix-ups, genotyping artifacts, and sex-chromosome abnormalities cannot be distinguished from these genotype calls alone. Accordingly, no cause was assigned to any discordant animal.
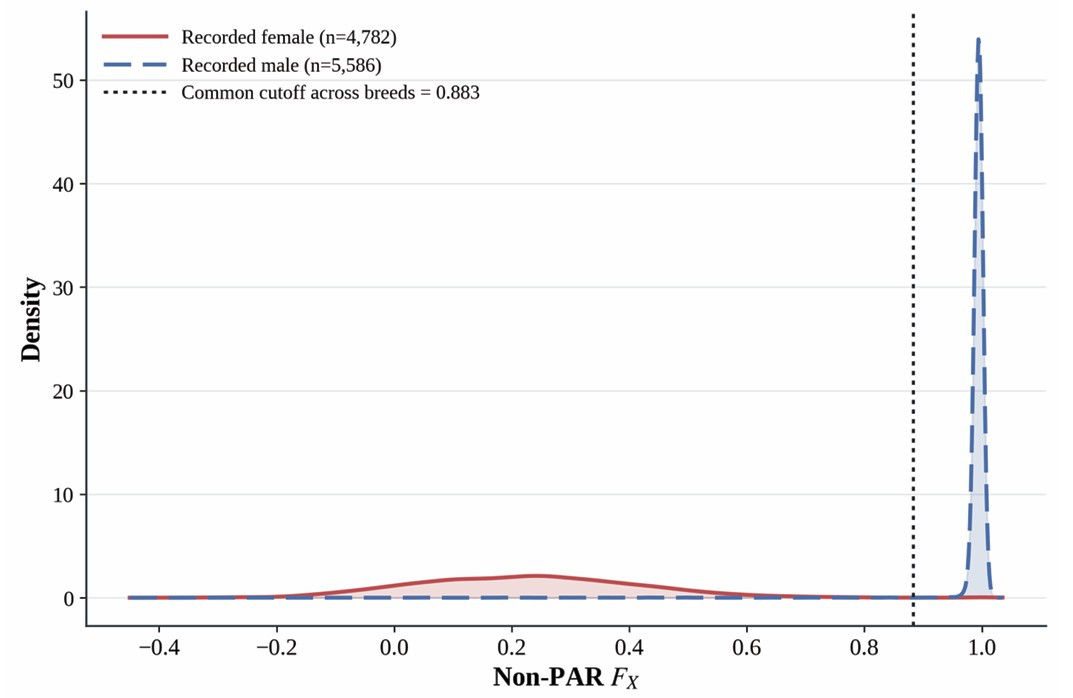
Figure 1. Distribution of non‑PAR X chromosome inbreeding coefficients (FX) by recorded sex. Red and blue curves represent 4,782 recorded females and 5,586 recorded males, respectively. Values were calculated with 2,385 SNPs and =0.382 estimated from females of all 3 breeds. The dotted line marks the cutoff of 0.883 estimated and evaluated using all 10,368 animals.
The secondary X-panel call-rate analysis retained 10,166 pigs. All 202 animals below 0.75 were recorded males. This pattern may reflect sex-specific genotype calling for the hemizygous male X chromosome, but raw signal intensities and genotype-calling configuration files were unavailable for direct evaluation. In the restricted subset, AUC rounded to 0.997, the same value reported for the all-animal analysis. Applying the unchanged cutoff of 0.883 gave 99.62% agreement and 39 disagreements, compared with 40 disagreements among all animals. This difference reflected the changed sample composition and was not interpreted as improved performance. Re-estimating the cutoff within the subset changed it to 0.906, but no retained animal had an FX value between the 2 cutoffs. Both cutoffs therefore classified the 10,166 retained animals identically. Because all omitted animals were recorded males, this analysis does not show that low-call-rate males can be excluded safely in routine use.
Using the pooled female reference, mean female FX was 0.394 in Duroc, 0.145 in Landrace, and 0.223 in Yorkshire, whereas male means were 0.991, 0.993, and 0.992. Within-breed AUCs were 0.990, 0.999, and 0.998, respectively. The corresponding all-animal cutoffs were 0.906, 0.836, and 0.706 (Table 3, Figure 2). Recorded sexes remained well separated within each breed, but the numerical cutoff differed by 0.200. These are cutoffs on the pooled-reference scale; they are distinct from recalculating scores with breed-specific allele frequencies. Breed-specific cutoffs did not consistently improve validation agreement.
Table 3. Performance within breed when all animals in that breed were analyzed using the pooled female reference
| Metric | Duroc | Landrace | Yorkshire |
|---|---|---|---|
| Animals, females / males (n) | 961 / 2,035 | 1,860 / 1,677 | 1,961 / 1,874 |
| Female mean FX | 0.394 | 0.145 | 0.223 |
| Male mean FX | 0.991 | 0.993 | 0.992 |
| AUC | 0.990 | 0.999 | 0.998 |
| Selected cutoff | 0.906 | 0.836 | 0.706 |
| Agreement with recorded sex, % | 99.13 | 99.83 | 99.84 |
| Disagreements (n) | 26 | 6 | 6 |
| FX: non-PAR X chromosome inbreeding coefficient; PAR: pseudoautosomal region; AUC: area under the receiver operating | |||
| characteristic curve. | |||
| These values were estimated and evaluated using all animals in each breed and were not obtained by cross‑validation. All 3 | |||
| breeds used the same pooled female reference. | |||
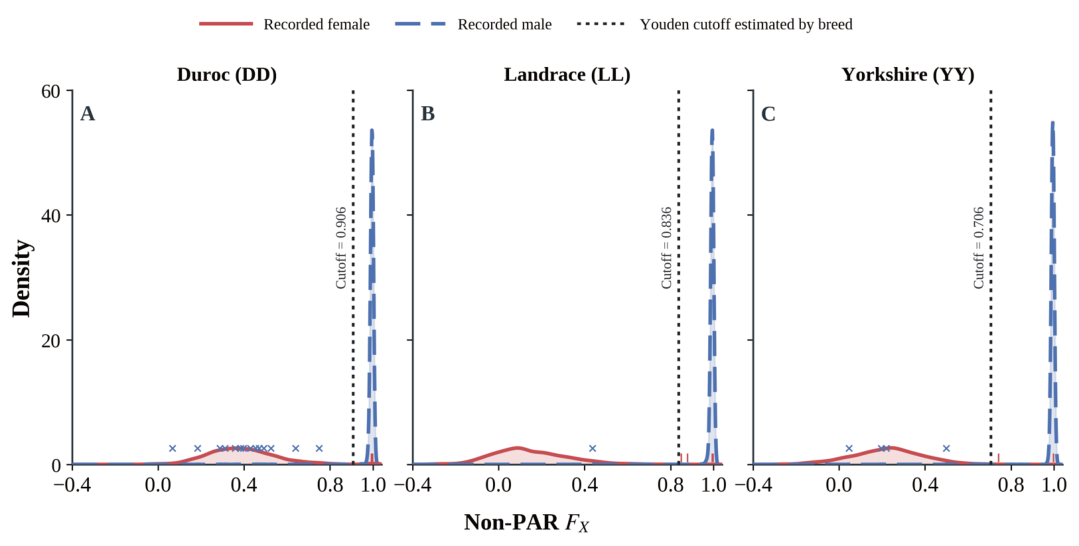
Figure 2. Distribution of non-PAR FX by recorded sex in (A) Duroc (DD), (B) Landrace (LL), and (C) Yorkshire (YY). Red solid and blue dashed curves represent recorded females and males, respectively. Black dotted vertical lines indicate breed-specific Youden cutoffs of 0.906, 0.836, and 0.706, respectively, estimated and evaluated using all animals in each breed under the same pooled female reference. Blue × symbols indicate recorded males with FX below the corresponding cutoff (classified as female); short red vertical ticks just above the x-axis mark recorded females with FX at or above the cutoff (classified as male). Each symbol marks an individual discordant animal at its FX value; symbols may overlap. Their vertical positions are offset for visibility and do not represent density values.
Pooled-reference female FX differed among breeds (Kruskal–Wallis H = 1,126.21, nominal p < 0.001). With the identical 2,385-SNP panel retained and only allele frequencies recalculated within breed, mean female FX decreased to 0.013 in Duroc, 0.052 in Landrace, and 0.030 in Yorkshire (Table 4 and Figure 3). The range among breed means decreased from 0.249 to 0.039, an 84.3% reduction. Since marker membership and each animal’s observed heterozygosity were unchanged, this score shift isolates the effect of the reference-frequency denominator on this selected panel. The earlier analysis that also repeated marker QC retained 1,883, 2,257, and 2,278 SNPs and gave means of 0.009, 0.051, and 0.029, respectively (83.1% range reduction). The fixed-panel comparison is the primary evidence for reference dependence; the re-filtered comparison changes both panel membership and reference frequencies.
Table 4. Female non‑PAR FX under pooled and within‑breed frequency references using the identical 2,385‑SNP panel
| Metric | Duroc | Landrace | Yorkshire |
|---|---|---|---|
| Females (n) | 961 | 1,860 | 1,961 |
| Identical markers (n) | 2,385 | 2,385 | 2,385 |
| Pooled‑reference mean FX | 0.394 | 0.145 | 0.223 |
| Within‑breed mean HE | 0.234 | 0.344 | 0.305 |
| Within‑breed mean FX | 0.013 | 0.052 | 0.030 |
| FX: non-PAR X chromosome inbreeding coefficient; HE: expected heterozygosity; PAR: pseudoautosomal region. | |||
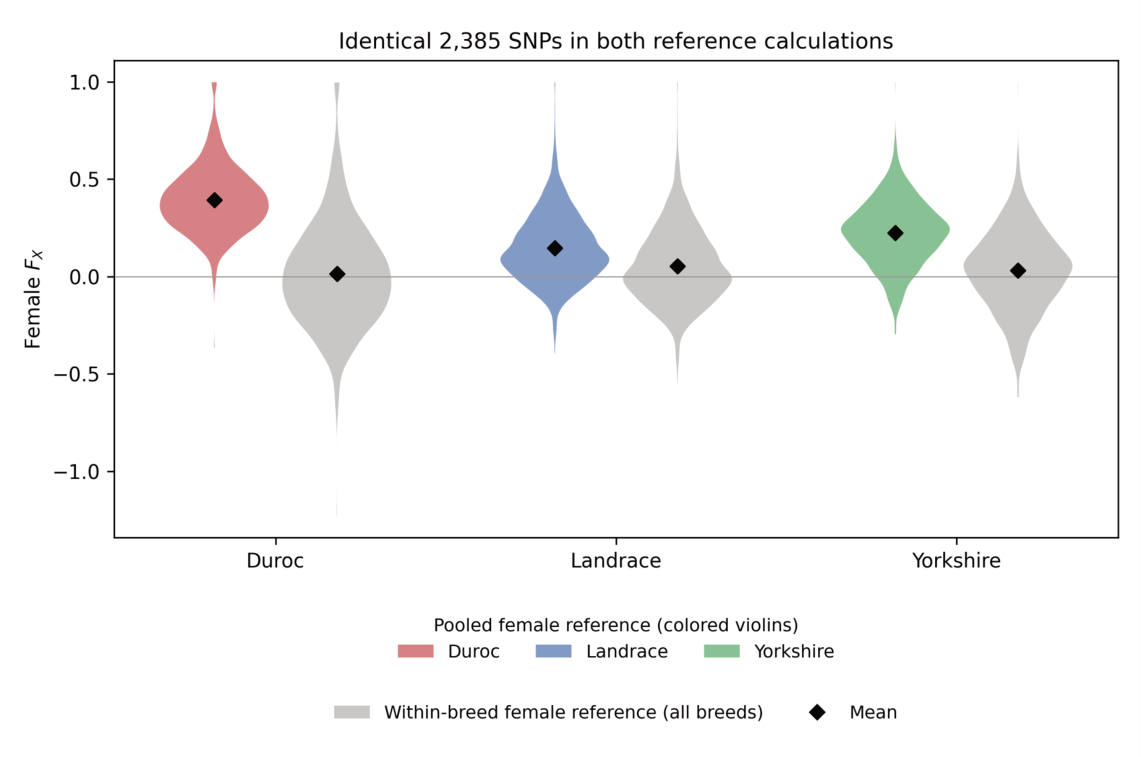
Figure 3. Female non‑PAR FX calculated with the same 2,385 SNPs under 2 frequency references. Red (Duroc), blue (Landrace), and green (Yorkshire) distributions use frequencies estimated from pooled recorded females; gray distributions use frequencies estimated from recorded females of the same breed. No markers were removed or added in the within‑breed calculation. Black diamonds indicate the mean of each distribution. Changing the frequency reference alone reduced the range among breed means by 84.3%.
On the common female panel, HO = 0.295, HS = 0.306, and HT = 0.382. The difference between pooled and within-breed expected heterozygosity was HT − HS = 0.076, whereas the remaining difference between within-breed expected and observed heterozygosity was HS − HO = 0.011. The corresponding descriptive ratios were FIS = 0.037, FST = 0.198, and FIT = 0.228. Together with the fixed-panel reference comparison, the larger between-breed heterozygosity component was consistent with a substantial Wahlund effect. Biological inbreeding, relatedness, selection, finer population structure, and genotype calling may also contribute. These panel-level statistics should not be interpreted as genome-wide differentiation or individual inbreeding estimates.
The FX scale is reference dependent. A cutoff can show strong agreement within 1 population without being transferable to another population, array, or marker panel. Operational use should document the genome assembly, PAR boundary, female reference, retained markers, expected-heterozygosity calculation, X call rate, and cutoff. Calibration should be evaluated using validation groups appropriate to the intended deployment, with independent biological confirmation where sex accuracy is the target. A prespecified review interval around the cutoff could accommodate uncertain records, but its width and performance were not established here. Discordant or borderline records should prompt investigation of sample identity, Y chromosome evidence, raw intensity, and repeat genotyping rather than automatic sex reassignment. More elaborate models incorporating pedigree, batch, or signal-intensity information may be useful, but improved biological accuracy cannot be established from the present unverified labels alone.
Recorded sex was not independently verified, and the causes of the 40 disagreements remain unresolved. Raw intensity and probe sequences were unavailable, markers in linkage disequilibrium were not pruned, and the data came from 1 commercial breeding program and 1 array. Sire- and dam-grouped validation reduced overlap for the selected parent grouping separately; it did not remove all pedigree connections, parent– offspring links, or distant genomic relatedness across folds. Farm validation involved only 2 farms and was partly confounded with breed. Genotyping-batch and collection-period validation was not conducted because verified sample-level batch and collection-date assignments were not available in the analysis inputs; birth date is not a substitute for either. The original DeLong/Wilson intervals and Kruskal–Wallis test assume independent animals. External validation with independently confirmed biological sex remains necessary.
Non-PAR FX showed strong agreement with recorded sex in 10,368 pigs. Repeated sire- and dam-grouped validation yielded mean AUC values of 0.9967 and 0.9968 and mean agreement of 99.59% in both designs, with similarly high internal agreement in farm-held-out analysis. These results support robustness to the tested partitions within this breeding program; they do not measure accuracy against independently confirmed biological sex or establish performance in another breeding program.
Holding 2,385 SNPs fixed while changing only the female frequency reference reduced the range among breed mean FX values by 84.3%, providing direct evidence of reference dependence on this panel. Breed-specific cutoffs did not consistently improve validation agreement. The practical implication is to calibrate the score and decision rule to the target population, assess them with appropriate grouped validation, and investigate discordant animals using independent evidence. The data do not establish a universal cutoff.
The authors thank the commercial pig-breeding company that collected and provided the genotype and pedigree data used in this study.
Conceptualization: Lee D. Data curation: Lim G, Han Y. Formal analysis: Lim G, Lee D.
Methodology: Lim G, Lee D. Software: Lee D. Validation: Han Y, Kim Y. Visualization: Lim G.
Writing – original draft: Lim G. Writing – review & editing: Han Y, Kim Y, Lee D.
Supervision: Lee D. Funding acquisition: Lee D. All authors read and approved the final manuscript.
The authors declare that no potential conflict of interest exists with respect to this study.
Ethical approval was not required for this retrospective analysis because only previously collected genotype and pedigree records were used, and no additional animal handling, sampling, or experimental procedures were performed for this study.
This work was supported by a research grant from Hankyong National University for an academic exchange program in 2026.
The following supplementary materials are available on the journal’s website:
Table S1. Recorded sex, X-chromosome score-based sex classification, inbreeding coefficients, and genotype call quality for the 40 discordant pigs identified using the pooled-reference 2,385-SNP panel and the all-animal cutoff
Generative AI assistance from OpenAI (including Codex) was used for drafting and language editing, preparation of responses to reviewers, and development and debugging of scripts for revision analyses and data-based figures. The authors retain responsibility for the study design, data, analyses, interpretation, and final manuscript.
Bilton TP, Chappell AJ, Clarke SM, et al. 2019. Using genotyping-by-sequencing to predict gender in animals. Animal Genetics 50(3):307–310. https://doi.org/10.1111/age.12782
Das PJ, Mishra DK, Ghosh S, et al. 2013. Comparative organization and gene expression profiles of the porcine pseudoautosomal region. Cytogenetic and Genome Research 141(1):26–36. https://doi.org/10.1159/000351310
DeLong ER, DeLong DM, Clarke-Pearson DL. 1988. Comparing the areas under two or more correlated receiver operating characteristic curves: A nonparametric approach. Biometrics 44(3):837–845. https://doi.org/10.2307/2531595
Grossi DA, Jafarikia M, Brito LF, et al. 2017. Genetic diversity, extent of linkage disequilibrium and persistence of gametic phase in Canadian pigs. BMC Genetics 18:6. https://doi.org/10.1186/s12863-017-0473-y
Kruskal WH, Wallis WA. 1952. Use of ranks in one-criterion variance analysis. Journal of the American Statistical Association 47(260):583–621. https://doi.org/10.1080/01621459.1952.10483441
Lee D. 2026. genomQC: A hierarchical evidence-based framework for biological validation, identity recovery, and reconstruction of livestock genomic resources (version 1.0.0). Zenodo. https://doi.org/10.5281/zenodo.21765620
McClure MC, McCarthy J, Flynn P, et al. 2018. SNP data quality control in a national beef and dairy cattle system and highly accurate SNP based parentage verification and identification. Frontiers in Genetics 9:84. https://doi.org/10.3389/fgene.2018.00084
Overall ADJ, Nichols RA. 2001. A method for distinguishing consanguinity and population substructure using multilocus genotype data. Molecular Biology and Evolution 18(11):2048–2056. https://doi.org/10.1093/oxfordjournals.molbev.a003746
Python Software Foundation. 2023. Python 3.12.1. https://www.python.org/downloads/release/python-3121/ (Accessed Aug 21, 2026).
Roberts DR, Bahn V, Ciuti S, et al. 2017. Cross-validation strategies for data with temporal, spatial, hierarchical, or phylogenetic structure. Ecography 40(8):913–929. https://doi.org/10.1111/ecog.02881
Ryan CA, Purfield DC, Matthews D, et al. 2024. Prevalence of sex-chromosome aneuploidy estimated using SNP genotype intensity information in a large population of juvenile dairy and beef cattle. Journal of Animal Breeding and Genetics 141(5):571–585. https://doi.org/10.1111/jbg.12866
Tang Z, Fu Y, Xu J, et al. 2020. Discovery of selection-driven genetic differences of Duroc, Landrace, and Yorkshire pig breeds by EigenGWAS and Fst analyses. Animal Genetics 51(4):531–540. https://doi.org/10.1111/age.12946
Wahlund S. 1928. Zusammensetzung von Populationen und Korrelationserscheinungen vom Standpunkt der Vererbungslehre aus betrachtet [Composition of populations and correlation phenomena viewed from the standpoint of heredity]. Hereditas 11(1):65–106. https:// doi.org/10.1111/j.1601-5223.1928.tb02483.x
Warr A, Affara N, Aken B, et al. 2020. An improved pig reference genome sequence to enable pig genetics and genomics research. GigaScience 9(6):giaa051. https://doi.org/10.1093/gigascience/giaa051
Wilson EB. 1927. Probable inference, the law of succession, and statistical inference. Journal of the American Statistical Association 22(158):209– 212. https://doi.org/10.1080/01621459.1927.10502953
Wright S. 1951. The genetical structure of populations. Annals of Eugenics 15(4):323–354. https://doi.org/10.1111/j.1469-1809.1949.tb02451.x
Youden WJ. 1950. Index for rating diagnostic tests. Cancer 3(1):32–35. https://doi.org/10.1002/1097-0142(1950)3:1<32::AID- CNCR2820030106>3.0.CO;2-3