
Dayeon Kang1,2,†, Seongmin Kim1,2,†, Sung-Lim Lee3, Jaemin Kim1,2,*
1Division of Applied Life Science (BK21), Gyeongsang National University, Jinju 52828, Republic of Korea
2Institute of Agriculture and Life Sciences, Gyeongsang National University, Jinju 52828, Republic of Korea
3College of Veterinary Medicine, Gyeongsang National University, Jinju 52828, Republic of Korea
†These authors contributed equally to this work.
Correspondence to Jaemin Kim, E-mail: jmkim85@gnu.ac.kr
Volume 10, Number 2, Pages 33–42, June 2026.
Journal of Animal Breeding and Genomics 2026, 10(2), 33–42. https://doi.org/10.12972/jabng.2026.10.2.1
Received on June 02, 2026, Revised on June 16, 2026, Accepted on June 19, 2026, Published on June 30, 2026.
Copyright © 2026 Korean Society of Animal Breeding and Genetics.
This is an Open Access article distributed under the terms of the Creative Commons Attribution Non-Commercial License (http://creativecommons.org/licenses/by-nc/4.0).

Whole-genome bisulfite sequencing (WGBS), DNA methylation, Differentially methylated region (DMR)
DNA methylation is a key epigenetic mechanism that contributes to gene expression regulation, development, aging, and disease-related biological processes without altering the underlying genomic sequence. In mammals, DNA methylation predominantly occurs at cytosines within CpG dinucleotides, with distinct patterns across promoters, gene bodies, enhancers, and intergenic regions (Jones, 2012). Changes in these methylation patterns can provide important information for identifying regulatory regions associated with specific phenotypes or disease states (Moore et al., 2013).
Whole-genome bisulfite sequencing (WGBS) is a widely used approach for profiling DNA methylation at single-base resolution across the entire genome. During bisulfite treatment, unmethylated cytosines are converted and subsequently read as thymines, whereas methylated cytosines remain unchanged and are read as cytosines. Therefore, methylation levels at individual CpG sites (CpGs) can be estimated based on the ratio of methylated reads to total reads. These methylation profiles can be used to identify differentially methylated positions (DMPs) at single-CpG resolution, as well as differentially methylated regions (DMRs), which represent genomic regions where adjacent CpGs show coordinated methylation changes (Peters et al., 2021; Wu et al., 2015).
Because WGBS data are generated from bisulfite-treated DNA, they have distinct characteristics compared with conventional DNA sequencing data. In particular, the conversion of unmethylated cytosines to thymines increases C-to-T mismatches and alters the nucleotide composition of sequencing reads. Therefore, dedicated alignment and methylation calling procedures that account for bisulfite conversion are required. Accordingly, this practical technical protocol integrates established bioinformatic tools into a reproducible workflow for methylation profiling from raw WGBS reads and for identifying and annotating differentially methylated regions associated with phenotypic traits.
Whole-genome bisulfite sequencing (WGBS) uses genomic DNA as input material for methylation profiling. Genomic DNA can be obtained from several biological sources, including whole blood, tissue, cultured cells, FFPE samples, and cell-free DNA. Whole blood is commonly used when blood cell-associated or systemic methylation profiles are required, because it provides sufficient genomic DNA from circulating nucleated cells. For the example analysis, we used a whole blood-derived WGBS dataset from 24 Beagle dogs. The samples were divided into three age groups, including 3, 5, and 10 years, with eight individuals in each group. Detailed information on sample age, sex and sequencing quality metrics are provided in Table 1.
Table 1. Sample information used in this study.
| Sample | Age | Sex | Total reads (paired-end) | Q30 (%) | Mapping rate (%) | Bisulfite conversion rate (%) | Duplication rate (%) | Mean CpG coverage |
|---|---|---|---|---|---|---|---|---|
| Beagle_age3_1 | 3 | Male | 1,353,281,120 | 88.4 | 55.7 | 97.2 | 20.2 | 20.8 |
| Beagle_age3_2 | 3 | Male | 1,403,819,600 | 89.6 | 57.5 | 97.2 | 22.9 | 22.7 |
| Beagle_age3_3 | 3 | Male | 986,433,636 | 89.1 | 56 | 97.2 | 16.9 | 15.7 |
| Beagle_age3_4 | 3 | Male | 2,634,334,886 | 88.6 | 54.7 | 97.2 | 24.9 | 37.7 |
| Beagle_age3_5 | 3 | Male | 2,015,604,634 | 88.4 | 55.3 | 97.2 | 17.6 | 31.8 |
| Beagle_age3_6 | 3 | Male | 1,777,321,162 | 88.2 | 54.3 | 97.1 | 19.1 | 26.6 |
| Beagle_age3_7 | 3 | Male | 1,879,940,264 | 88.7 | 54.4 | 97.1 | 21.9 | 27.3 |
| Beagle_age3_8 | 3 | Male | 1,559,362,186 | 88.3 | 53.7 | 97.1 | 19.7 | 23.3 |
| Beagle_age5_1 | 5 | Male | 1,764,614,642 | 89.1 | 52.1 | 96.9 | 26 | 23.0 |
| Beagle_age5_2 | 5 | Female | 1,721,444,108 | 90.4 | 54.5 | 97 | 26.6 | 23.5 |
| Beagle_age5_3 | 5 | Male | 1,459,506,546 | 90 | 52.7 | 96.8 | 34.1 | 17.4 |
| Beagle_age5_4 | 5 | Female | 1,451,471,946 | 88.6 | 52.1 | 96.9 | 19.7 | 19.8 |
| Beagle_age5_5 | 5 | Female | 2,187,145,272 | 90.3 | 54.1 | 96.7 | 23.2 | 30.7 |
| Beagle_age5_6 | 5 | Male | 1,416,932,860 | 88.1 | 51.8 | 96.9 | 18.4 | 19.6 |
| Beagle_age5_7 | 5 | Female | 1,915,336,676 | 90.1 | 54 | 96.8 | 21.5 | 27.7 |
| Beagle_age5_8 | 5 | Male | 1,196,465,602 | 89.2 | 50.3 | 96.8 | 21.6 | 15.8 |
| Beagle_age10_1 | 10 | Female | 2,107,722,632 | 90 | 53.5 | 97 | 26.3 | 27.8 |
| Beagle_age10_2 | 10 | Female | 1,510,570,970 | 90 | 54.1 | 96.9 | 23.3 | 21.4 |
| Beagle_age10_3 | 10 | Female | 1,968,758,068 | 90.5 | 53.9 | 96.8 | 22.4 | 28.3 |
| Beagle_age10_4 | 10 | Male | 997,316,236 | 89.1 | 50.7 | 97.1 | 13.5 | 14 |
| Beagle_age10_5 | 10 | Male | 915,578,220 | 89.2 | 50.9 | 97 | 14.6 | 12.8 |
| Beagle_age10_6 | 10 | Male | 1,061,334,740 | 89.2 | 50.8 | 97 | 12.7 | 14.9 |
| Beagle_age10_7 | 10 | Male | 1,044,247,260 | 89.5 | 51 | 97 | 13.9 | 14.7 |
| Beagle_age10_8 | 10 | Female | 1,444,609,124 | 89.5 | 51.3 | 97 | 16.5 | 19.4 |
For WGBS using whole blood, blood is collected into a tube containing an anticoagulant and stored at 4﹎ for short-term and -80﹎ for long-term storage to preserve DNA quality (Baoutina et al., 2019). Genomic DNA is extracted using a blood DNA extraction kit, such as the Exgene Blood SV mini kit, according to the manufacturer*s protocol. The extracted DNA is evaluated for concentration, purity, and integrity before library preparation (GeneAll Biotechnology, 2024).
For library construction using the xGen Methyl-Seq DNA Library Prep Kit, genomic DNA is fragmented before bisulfite conversion. DNA is typically sheared to about 350 bp using a focused ultrasonicator. The fragmented DNA is then subjected to bisulfite conversion using a compatible conversion kit, such as the EZ DNA Methylation-Gold Kit (Zymo Research, 2021). During this process, unmethylated cytosines are converted and read as thymines after sequencing, whereas methylated cytosines remain as cytosines (Frommer et al., 1992).
After bisulfite conversion, the resulting single-stranded DNA fragments are used to construct sequencing libraries with the xGen Methyl-Seq DNA Library Prep Kit. This process generates indexed sequencing libraries through adapter attachment, extension, ligation, PCR amplification, and purification. Qualified libraries are sequenced using an Illumina paired-end sequencing platform with 150 bp paired-end reads. Base-calling data are demultiplexed using bcl2fastq v2.20.0.422 (Illumina Inc., San Diego, CA, USA) to generate paired-end FASTQ files for downstream WGBS analysis (Integrated DNA Technologies, 2023).
The quality of raw bisulfite sequencing reads is first examined using FastQC (Andrews, 2010). This step is required to evaluate per-base sequence quality, GC content, sequence duplication levels, overrepresented sequences, and adapter contamination (Fig. 1).
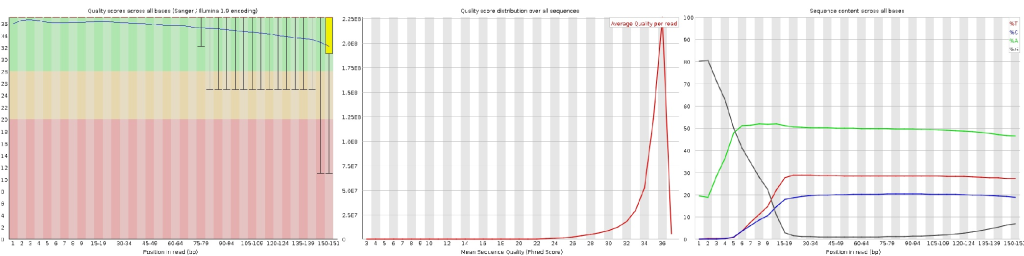
Fig. 1. Quality assessment of raw WGBS reads. FastQC was used to assess the quality of raw bisulfite sequencing reads before preprocessing. The representative plots show per base sequence quality, per sequence quality scores, and per base sequence content.
Adapter sequences and low-quality bases are removed using Trim Galore v0.6.7 (Krueger, 2015) (Fig. 2). Bases with a Phred quality score below 20 are trimmed, and paired-end reads are processed together to preserve read-pair information. After trimming, the cleaned FASTQ files are used for bisulfite-aware alignment.
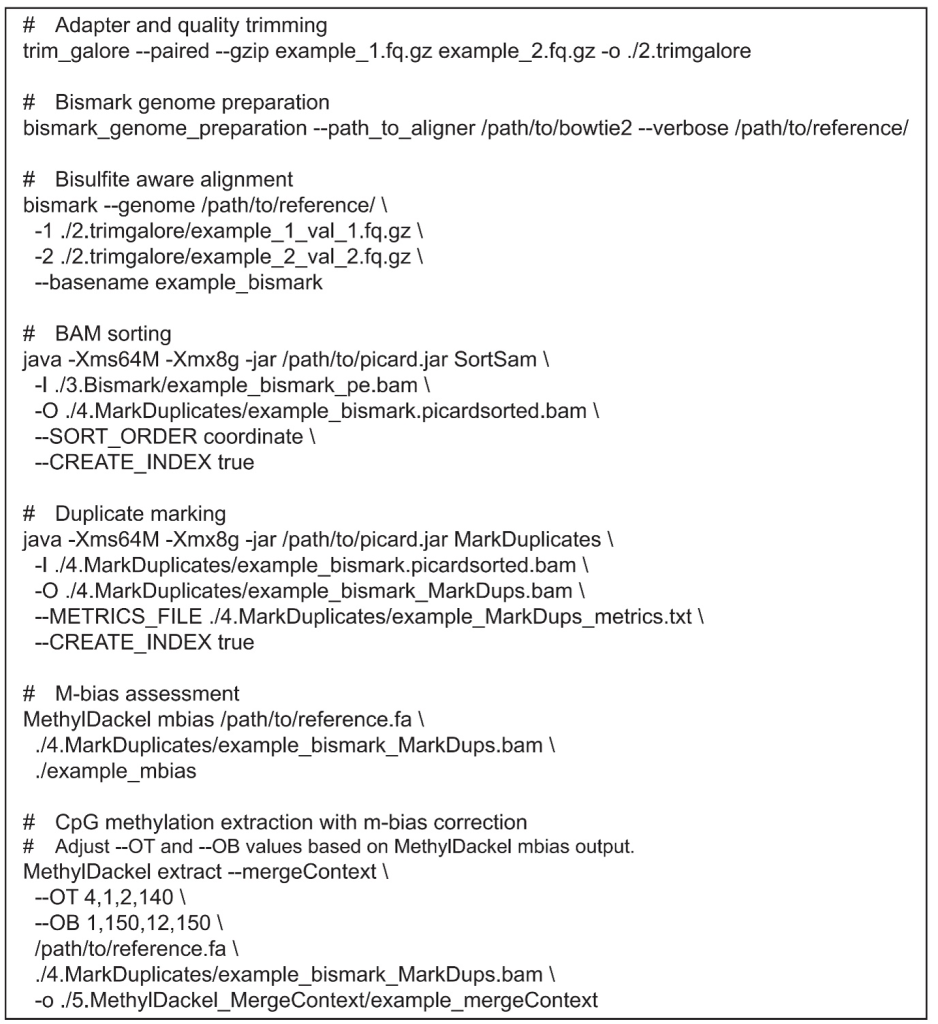
Fig. 2. Command-line workflow for WGBS read preprocessing and CpG methylation calling. The commands illustrate the sequential steps of adapter trimming (Trim Galore), bisulfite genome preparation and bisulfite-aware alignment (Bismark), duplicate marking (Picard Tools), M-bias assessment and methylation extraction with bias correction (MethylDackel).
Before read mapping, the reference genome must be prepared for bisulfite alignment using the bismark_genome_preparation command in Bismark v0.22.3 (Krueger and Andrews, 2011). This command requires the path to the Bowtie2 aligner (–path_to_aligner) and the directory containing the reference genome FASTA file as inputs. Upon completion, a Bisulfite_Genome subdirectory is created within the reference genome directory, containing bisulfite-converted sequences and Bowtie2 index files. This prepared reference directory is then specified using the –genome option during Bismark alignment. Trimmed reads are then aligned to the prepared reference genome using Bismark with Bowtie2. For directional WGBS libraries, alignment is performed in directional mode, in which complementary strand alignments are not considered.
Post-alignment processing is performed using Picard Tools (Broad Institute, 2019). Aligned reads are sorted using SortSam v2.23.9, and PCR duplicates are removed using MarkDuplicates v2.26.2. Duplicate removal is required to reduce potential amplification bias before methylation calling.
Before methylation extraction, M-bias can be assessed using MethylDackel mbias to detect potential end-repair bias at the 5′ or 3′ ends of reads (Fig. 3). If the bias is observed, inclusion bounds can be applied via the –OT and –OB options in MethylDackel extract to exclude biased positions from methylation calling. CpG methylation levels are extracted from the processed alignment files using MethylDackel (https://github.com/dpryan79/MethylDackel). The –extract function is used to obtain methylated and unmethylated cytosine counts, and –mergeContext is used to merge complementary CpG contexts. For each CpG site, the methylation ratio is calculated as the number of methylated reads divided by the total number of methylated and unmethylated reads. The resulting methylation ratio ranges from 0 to 1 and is used as the CpG-level methylation value for downstream analysis.
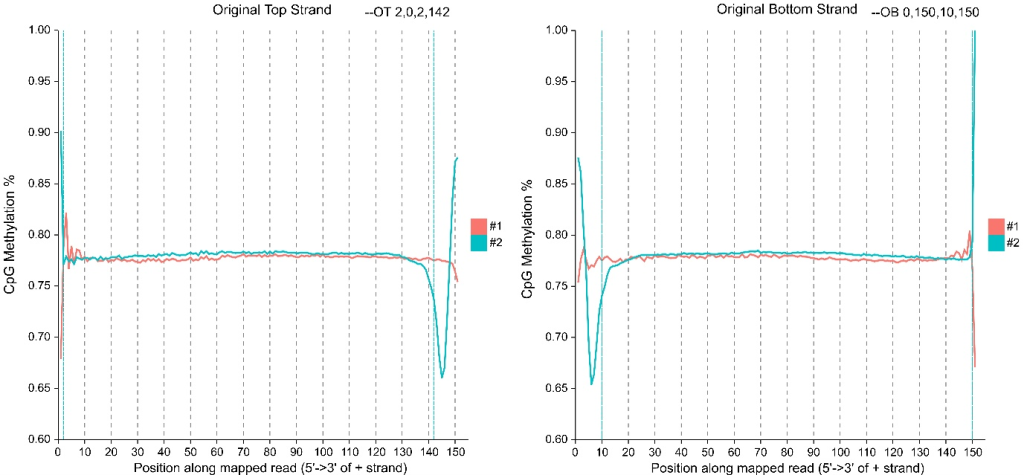
Fig. 3. Example M-bias plots from a Beagle WGBS sample. The original top strand (OT) and original bottom strand (OB) are shown. End-repair bias is visible at the 3′ end of read 2 (#2) on the OT strand and at the 5′ end of read 2 (#2) on the OB strand. Dashed vertical lines indicate the suggested inclusion bounds (–OT 2,0,2,142 and –OB 0,150,10,150) recommended by MethylDackel mbias. #1 and #2 indicate read 1 and read 2, respectively.
Before the detection of differentially methylated regions (DMRs), CpG-level methylation ratios generated from the WGBS preprocessing workflow are organized into a methylation matrix. Each row of the matrix represents a CpG site, and each column represents an individual sample.
Several tools can be used for DMR detection from WGBS data, and the appropriate tool should be selected based on the input data structure, statistical framework, and DMR detection strategy (Table 2). In this protocol, metilene v0.2.9 is used because it directly detects de novo DMRs from CpG-level methylation values arranged by genomic coordinates (Jühling et al., 2016). By default, MethylDackel extract reports methylation metrics for cytosines with a minimum coverage of one read; therefore, CpG sites with total coverage ‾1 were retained for downstream analysis. For age-associated DMR analysis, pairwise comparisons are conducted between age groups based on the experimental design. When interpreting methylation gain or loss with age, the comparison order should be defined consistently because the sign of the mean methylation difference depends on group assignment. For example, assigning the older age group as the first group allows methylation direction to be interpreted consistently across comparisons.
Table 2. Comparison of tools for DMR detection in bisulfite sequencing data.
| Tool | Applicable data | Statistical test | DMR detection strategy |
|---|---|---|---|
| metilene | WGBS, RRBS, targeted bisulfite sequencing | 2D Kolmogorov-Smirnov test and Mann-Whitney U test | Segments consecutive CpGs based on methylation differences |
| DSS | WGBS, RRBS, BS-seq data | Wald test based on beta-binomial modeling | Detects DMLs or DMRs using count-based methylation data |
| methylKit | WGBS, RRBS, targeted bisulfite sequencing | Fisher’s exact test or logistic regression | Tests differential methylation at CpG or regional levels |
| DMRcate | WGBS, 450K/EPIC methylation array | Limma-based differential methylated statistics | Smooths CpG-level differential signals to define regions |
| BSmooth / bsseq | WGBS, RRBS | t-statistic based on smoothed methylation profiles | Detects regions from locally smoothed methylation patterns |
| RADMeth | WGBS, BS-seq data | Likelihood ratio test based on beta-binomial regression | Tests differential methylation with replicate or multifactor designs |
For metilene analysis, CpG methylation ratios from individual samples are merged into a single matrix file. The metilene input matrix must be tab-separated and sorted by genomic coordinates (Fig. 4). The first column contains the chromosome, the second column contains the CpG position, and the remaining columns contain methylation ratios for each sample. In the metilene input matrix, each row represents one CpG site, and methylation values are represented as ratios ranging from 0 to 1.
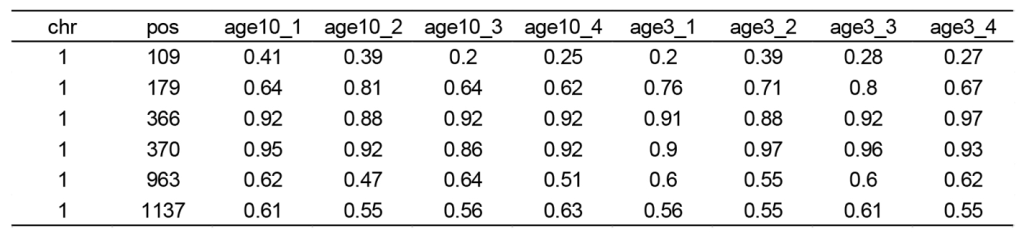
Fig. 4. Structure of metilene input matrix.
The sample names in the header must include group-specific prefixes because metilene assigns samples to comparison groups based on these prefixes (Fig. 5). For example, sample names beginning with groupA and groupB can be compared using the &-a groupA* and &-b groupB* options. Although sample columns do not need to be ordered by group, the input matrix must be sorted by chromosome and genomic position because metilene detects DMRs based on consecutive CpG methylation patterns along the genome.

Fig. 5. Metilene workflow for DMR detection and output interpretation.
Using the sorted metilene input matrix, de novo DMR detection is performed for each pairwise age comparison. The group prefixes defined in the input matrix header are used during metilene execution (Table 3). When the direction of methylation change is interpreted, the comparison groups should be assigned consistently, because the sign of the mean methylation difference depends on the order of group assignment. At each CpG position, the methylation difference between the two groups is calculated, and neighboring CpGs with consistent methylation difference patterns are segmented into candidate DMRs.
Table 3. Description of parameters used for metilene input file generation.
| Parameter | Description |
|---|---|
| –in1 | A comma-separated list of sorted BED or bedGraph input files corresponding to Group 1 |
| –in2 | A comma-separated list of sorted BED or bedGraph input files corresponding to Group 2 |
| –out | Output path and file name for the generated metilene input file |
| –h1 | Identifier for Group 1 |
| –h2 | Identifier for Group 2 |
| -b | Path to the bedtools executable. If not specified, bedtools registered in the system PATH will be used |
The raw output files generated by metilene are processed using the metilene_output.pl script. This script converts raw metilene results into processed DMR output files and generates summary plots for result inspection (Fig. 6). The summary plots include the distribution of mean methylation differences, DMR length, number of CpGs within DMRs, relationship between mean methylation difference and q-value, mean methylation levels between comparison groups, and relationship between DMR length and CpG count. These plots are used to review whether the DMR results show directional bias or are concentrated in specific region-length ranges before downstream analysis.
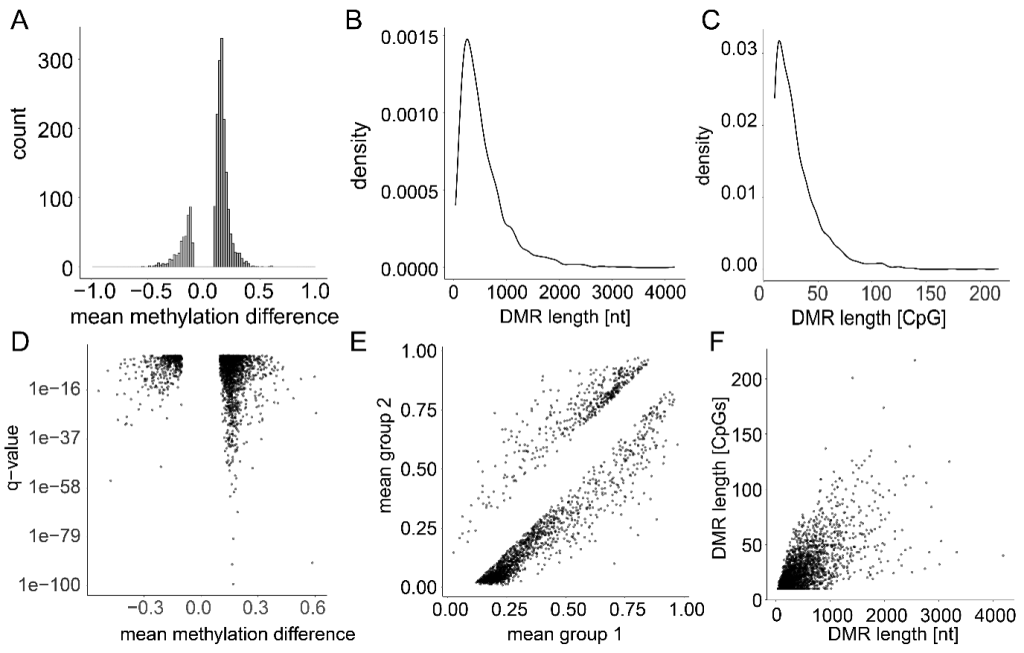
Fig. 6. Summary plots of DMR results. The summary plots generated by metilene_output.pl were used to review the distribution and quality of DMR results. (A) Mean methylation difference. (B) DMR length. (C) CpG count per DMR. (D) Mean methylation difference versus q-value. (E) Mean methylation levels between groups. (F) DMR length versus CpG count.
The metilene output file is provided in a bed-like format, in which each row represents one candidate DMR. The output includes genomic coordinates, q-value, mean methylation difference, number of CpGs, Mann-Whitney U test p-value, two-dimensional Kolmogorov-Smirnov test (KS-test) p-value, and mean methylation levels for each comparison group (Table 4). Candidate DMRs can be filtered using q-value, CpG count, DMR length, and mean methylation difference. In metilene_output.pl, the default filtering settings include a q-value threshold of 0.05 and a minimum mean methylation difference threshold of 0.1. In practice, the final filtering thresholds should be selected and reported according to data quality, CpG coverage, sample size, and the objective of the analysis.
Table 4. Description of columns in the metilene DMR output file.
| Column | Description |
|---|---|
| chr | Chromosome where the DMR is located |
| start | Start position of the DMR |
| stop | End position of the DMR |
| q-value | Significance value after multiple testing correction |
| mean methylation difference | Difference in mean methylation level between the two groups |
| #CpGs | Number of CpG sites included in the DMR |
| p (MWU) | p-value from the Mann-Whitney U test |
| p (2D KS) | p-value from the two-dimensional Kolmogorov-Smirnov test |
| mean g1 | Mean methylation level of the DMR in Group 1 |
| mean g2 | Mean methylation level of the DMR in Group 2 |
The WGBS DMR workflow was applied to CpG-level methylation data generated from whole blood-derived genomic DNA of 24 Beagle dogs. Because the practice dataset was generated from Beagle dogs, the Canis lupus familiaris reference genome ROS_Cfam_1.0 was used for Bismark genome preparation and read alignment. The dataset consisted of three age groups, including 3, 5, and 10 years, with eight individuals in each group. Autosomal CpGs commonly detected across all samples were retained to construct the methylation matrix for DMR analysis. Three pairwise comparisons were conducted between age groups (age5 versus age3, age10 versus age5, and age10 versus age3). In each comparison, the older age group was assigned as the first comparison group to maintain consistent interpretation of methylation direction. Therefore, positive mean methylation differences indicate higher methylation levels in the older group, whereas negative mean methylation differences indicate lower methylation levels in the older group.
Before methylation extraction, M-bias was assessed for all 24 samples using MethylDackel mbias. End-repair bias was observed at the 5′ end of read 2 on the original bottom strand and at the 3′ end of read 2 on the original top strand, consistent with the known characteristics of the xGen Methyl-Seq library preparation kit. The mean CpG methylation level difference before and after applying inclusion bounds (–OT 4,1,2,140 and –OB 1,150,12,150) was less than 0.3% across all 24 Beagle samples (range: +0.186% to +0.516%), confirming a negligible effect on downstream analysis. For users who wish to minimize end-repair bias, we recommend applying –OT and –OB options with values suggested by MethylDackel mbias results.
After metilene-based de novo DMR detection, candidate regions located on autosomes were retained for downstream analysis. The number of candidate regions located on autosomes was 11,533 in the age5 versus age3 comparison, 10,750 in the age10 versus age5 comparison, and 8,255 in the age10 versus age3 comparison. These values represent candidate regions located on autosomes before applying the final DMR filtering criteria. Final DMRs were selected using the default metilene filtering criteria, including q-value < 0.05, CpG count ‾ 10, and absolute mean methylation difference ‾ 0.1, to retain statistically significant regions supported by multiple CpG sites and showing sufficient methylation differences for downstream interpretation. No additional DMR length threshold was applied during final filtering. After applying these criteria, 946 DMRs were identified in the age5 versus age3, 947 DMRs in the age10 versus age5, and 512 DMRs in the age10 versus age3. These final DMRs represent regions that passed the statistical significance, CpG count, and methylation difference thresholds after autosomal filtering.
The direction of methylation change was then summarized based on the sign of the mean methylation difference. In the age5 versus age3 comparison, 585 hypermethylated DMRs and 361 hypomethylated DMRs were identified (Fig. 7). In the age10 versus age5 comparison, 252 hypermethylated DMRs and 695 hypomethylated DMRs were identified. In the age10 versus age3 comparison, 264 hypermethylated DMRs and 248 hypomethylated DMRs were identified.
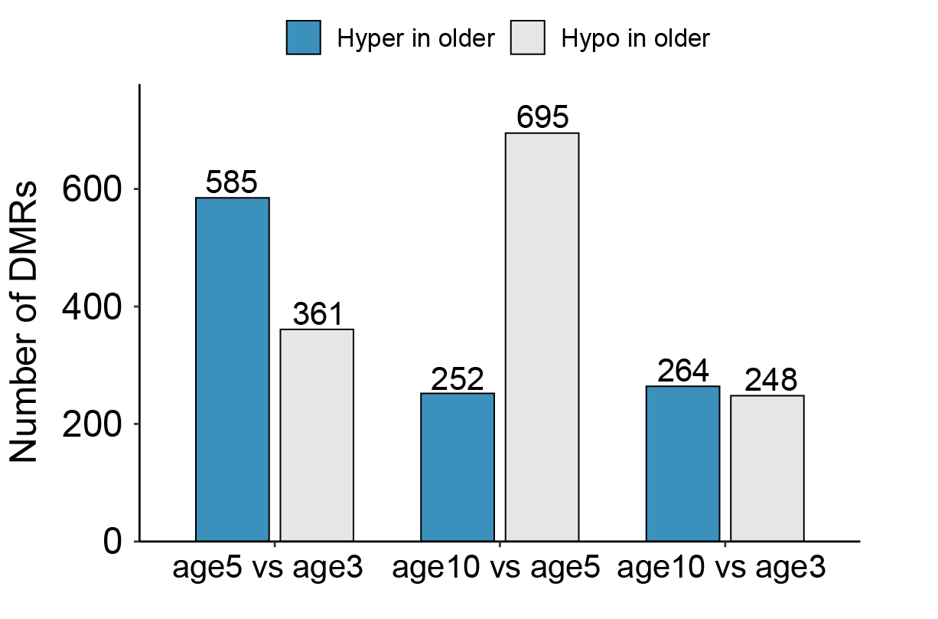
Fig. 7. Hypermethylated and hypomethylated DMRs across age comparisons.
These results demonstrate how age-associated DMRs can be identified and summarized using a Beagle WGBS dataset. The final DMRs can be used for downstream analyses such as genomic annotation, overlap-based comparison across age groups, identification of DMR-associated genes, and functional enrichment analysis. When interpreting these results, it is important to consider that DMR counts can be affected by filtering thresholds, CpG coverage, sample size, and the direction of group comparison.
This technical protocol provides a structured workflow for WGBS DNA methylation analysis, from raw data processing to CpG methylation calling and de novo DMR detection using metilene. By using CpG methylation values arranged by genomic coordinates, this workflow enables the identification of genomic regions showing coordinated methylation differences between comparison groups. This is important because DMR analysis converts site-level methylation information into region-based results that can be more directly used for genomic interpretation.
The practice example using a Beagle WGBS dataset demonstrates how metilene candidate regions can be filtered, classified according to methylation direction, and converted into a final DMR set. These final DMRs provide a practical basis for downstream analyses such as genomic annotation, overlap comparison, DMR-associated gene identification, and functional enrichment analysis.
No potential conflict of interest relevant to this article is reported.
This study was conducted in accordance with the guidelines approved by the Institutional Animal Care and Use Committee of the National Institute of Animal Science (NIAS 2022-586) and Gyeongsang National University (GNU-240802-D0152-01, GNU-250829-D0191). All animal procedures complied with the NIAS Guidelines for the Care and Use of Laboratory Animals and adhered to the ethical standards set by the committees. This study was supported by a grant from the Cooperative Research Program for Agriculture Science & Technology Development (Project no. RS-2022-RD010282), NIAS, Rural Development Administration, Republic of Korea.
1. Andrews S. 2010. FastQC: a quality control tool for high throughput sequence data. https://www.bioinformatics.babraham.ac.uk/projects/fastqc/. (2026.05.27).
2. Baoutina A., Bhat S., Partis L., Emslie K. R. 2019. Storage stability of solutions of DNA standards. Anal Chem 91: 12268-74.
[DOI][PubMed]
3. Broad Institute. 2019. Picard toolkit. https://broadinstitute.github.io/picard/. (2026.05.27).
4. Frommer M., McDonald L. E., Millar D. S., Collis C. M., Watt F., Grigg G. W., et al. 1992. A genomic sequencing protocol that yields a positive display of 5-methylcytosine residues in individual DNA strands. Proceedings of the National Academy of Sciences 89: 1827-31.
[DOI][PubMed][PMC]
5. GeneAll Biotechnology. 2024. Exgene Blood SV protocol handbook. https://www.geneall.com/upload/%5BIFU%5D%20Exgene%E2%84%A2%20Blood%20SV_E.pdf. (2026.05.29.).
6. Integrated DNA Technologies. 2023. xGen Methyl-Seq DNA Library Prep Kit protocol. https://sfvideo.blob.core.windows.net/sitefinity/docs/default-source/protocol/xgen-methyl-seq-dna-library-prep-kit-protocol.pdf?sfvrsn=9fa7e007_11. (2026.05.29.).
7. Jones P. A. 2012. Functions of DNA methylation: islands, start sites, gene bodies and beyond. Nature reviews genetics 13: 484-92.
[DOI][PubMed]
8. Jühling F., Kretzmer H., Bernhart S. H., Otto C., Stadler P. F., Hoffmann S. 2016. Metilene: fast and sensitive calling of differentially methylated regions from bisulfite sequencing data. Genome Res 26: 256-62.
[DOI][PubMed][PMC]
9. Krueger F. 2015. Trim Galore!: A wrapper around Cutadapt and FastQC to consistently apply adapter and quality trimming to FastQ files, with extra functionality for RRBS data. https://www.bioinformatics.babraham.ac.uk/projects/trim_galore/. (2026.05.27).
10. Krueger F., Andrews S. R. 2011. Bismark: a flexible aligner and methylation caller for Bisulfite-Seq applications. Bioinformatics 27: 1571-2.
[DOI][PubMed][PMC]
11. Moore L. D., Le T., Fan G. 2013. DNA methylation and its basic function. Neuropsychopharmacology 38: 23-38.
[DOI][PubMed][PMC]
12. Peters T. J., Buckley M. J., Chen Y., Smyth G. K., Goodnow C. C., Clark S. J. 2021. Calling differentially methylated regions from whole genome bisulphite sequencing with DMRcate. Nucleic Acids Res 49: e109-e.
[DOI][PubMed][PMC]
13. Wu H., Xu T., Feng H., Chen L., Li B., Yao B., et al. 2015. Detection of differentially methylated regions from whole-genome bisulfite sequencing data without replicates. Nucleic Acids Res 43: e141.
[DOI][PubMed][PMC]
14. Zymo Research. 2021. EZ DNA Methylation-Gold Kit protocol. https://files.zymoresearch.com/protocols/_d5005_d5006_ez_dna_methylation-goldga_o_kit.pdf. (2026.05.28).