Minjun Kim1,6![]() , Jean Pierre Munyaneza1
, Jean Pierre Munyaneza1![]() , Eunjin Cho2
, Eunjin Cho2![]() , Aera Jang3
, Aera Jang3![]() , Cheorun Jo4
, Cheorun Jo4![]() , Ki-Chang Nam5
, Ki-Chang Nam5![]() , Hyo Jun Choo6
, Hyo Jun Choo6![]() , Jun Heon Lee1,2*
, Jun Heon Lee1,2*![]()
1Department of Animal Science, Chungnam National University, Daejeon 34134, Korea
2Department of Bio-AI Convergence, Chungnam National University, Daejeon 34134, Korea
3Department of Applied Animal Science, College of Animal Life Science, Kangwon National University, Chuncheon 24341, Korea
4Department of Agricultural Biotechnology, Center for Food and Bioconvergence, Research Institute of Agriculture and Life Sciences, Seoul National University, Seoul 08826, Korea
5Department of Animal Science and Technology, Sunchon National University, Suncheon 57922, Korea
6Poultry Research Center, National Institute of Animal Science, Rural Development Administration, Pyeongchang 25342, Korea
Correspondence to Jun Heon Lee, E-mail: junheon@cnu.ac.kr
Volume 9, Number 4, Pages 181-191, December 2025.
Journal of Animal Breeding and Genomics 2025, 9(4), 181-191. https://doi.org/10.12972/jabng.2025.9.4.1
Received on July 08, 2025, Revised on December 16, 2025, Accepted on December 18, 2025, Published on December 31, 2025.
Copyright © 2025 Korean Society of Animal Breeding and Genetics.
This is an Open Access article distributed under the terms of the Creative Commons Attribution Non-Commercial License (http://creativecommons.org/licenses/by-nc/4.0).

Improving the flavor of chicken meat while maintaining productivity has become an important goal in poultry breeding. This study investigated the genetic characteristics of 20 taste-active compounds (TACs) and carcass weight (CW) in the Korean native chicken red-brown line. The TACs encompassed a wide range of metabolites, including free amino acids, peptides, organic acids, and nucleotide-related compounds. Genetic parameters were estimated using data from 829 birds, applying a multi-trait genomic model. Most TACs showed moderate heritability. Among them, inosine and carnosine stood out with relatively high heritability estimates of 0.45 and 0.34, respectively, indicating strong potential for genetic improvement. Trait correlations reflected known metabolic relationships. For example, leucine and methionine were positively correlated with a coefficient of 0.68, while inosine and its metabolic precursor inosine-5-monophosphate (IMP) showed a strong negative correlation of 0.71, suggesting regulatory competition. In addition, several TACs demonstrated undesirable associations with CW. Acetate, in particular, had a phenotypic correlation of -0.44 with CW, implying that selection for flavor-related traits may affect growth performance if not properly balanced. These findings reveal that many flavor compounds are under moderate genetic control and have biologically meaningful interactions. Integrating these compounds into breeding objectives can help develop chickens with improved sensory qualities while maintaining acceptable production levels. This strategy supports a more consumer-oriented approach to native chicken breeding.
Korean native chicken, taste-active compound, genetic parameter estimation, heritability, genomic selection
Over the past century, global meat consumption has steadily risen due to factors such as economic advancement, increased urbanization, and innovations in meat production techniques (Thornton, 2010; Graça et al., 2014). Recently, however, consumer preferences have shifted toward meat that is both nutritious and of high quality (FAO, 2013; Bryant et al., 2019; Bryant and Barnett, 2020; Henchion et al., 2021). Compared to other meats, chicken is particularly favored for its affordability, high protein content, and low-fat composition (Shu et al., 2010; Chumngoen and Tan, 2015; Marangoni et al., 2015). Meat quality encompasses various characteristics, including pH, color, tenderness, water-holding capacity, intramuscular fat, and flavor, all of which contribute to consumer preference and market value (Jayasena et al., 2013; Jung et al., 2013; Sun et al., 2013; Ono et al., 2019). Multiple studies have shown that various traits positively correlate with meat quality, influencing consumer acceptance and meat price.
Taste and flavor, regarded as the most important traits of meat quality, are influenced by taste-active compounds such as IMP, which is the predominant nucleotide-related compound (NT) in meat. Additionally, free amino acids (FAAs) such as glutamic acid, glycine, and alanine also play key roles in enhancing meat flavor. These compounds contribute to the umami, sweet, and overall savory qualities of meat that are essential for consumer satisfaction. Together, these taste-active compounds interact to determine the characteristic flavor profile of meat, making them important targets for genetic improvement in meat production (Dashdorj et al., 2015).
Korean native chicken (KNC) represents an indigenous chicken population in Korea, classified into five lines based on feather color: white (KNC-W), black (KNC-B), yellow-brown (KNC-Y), gray-brown (KNC-G), and red-brown (KNC-R) (Jayasena et al., 2015; Seo et al., 2016; Jin et al., 2017; Kim et al., 2022). The KNC breed is valued for its high meat quality, with consumers often favoring KNC meat over that of commercial broilers for its unique flavor and taste profile (Choe et al., 2010; Jayasena et al., 2014; Seo et al., 2017). In particular, the KNC-R is recognized for its significant contribution to Woorimatdag, a popular commercial breed in Korea, as it was selected by the National Institute of Animal Science (NIAS) for its enhanced meat quality and production characteristics (Jung et al., 2013; Choi et al., 2015; Jung et al., 2015). This study aims to explore the potential of TAC traits as valuable selection criteria in breeding programs. Specifically, this research estimates the heritability and genetic correlations of TAC traits in breast meat of the KNC-R line, providing foundational insights for the genetic improvement of these flavor-related attributes.
In this study, chickens from the KNC-R line, maintained as a purebred line at the Poultry Research Institute of NIAS in Korea, were used. A total of 829 (320 male and 509 female) chickens were selected across four generations (one generation spanning 52 weeks) for this experiment. For population continuity, 30 male and 210 female birds were chosen annually as breeding parents to establish each new generation. Importantly, the selection criteria excluded nucleotide-related traits, ensuring that selection practices did not impact the results obtained from this population. All chickens in each generation were hatched simultaneously and reared in battery cages within a controlled, windowless facility at the Poultry Research Institute. From hatching until 10 weeks of age, birds were provided with ad libitum access to feed and water. A starter diet was given from hatch to 6 weeks, followed by a grower diet from 7 to 10 weeks. Environmental factors, including temperature, humidity, housing conditions, and stocking density, were carefully regulated throughout the study. At 10 weeks, blood samples were collected from the experimental chickens before they were rendered unconscious through CO2 exposure. The birds were then exsanguinated via neck cut, after which carcass weight and breast meat samples were collected. Breast meat samples were stored at -80°C until analysis, while blood samples were kept at -20 °C for subsequent DNA extraction. All animal procedures adhered to the guidelines set by the Institutional Animal Care and Use Committee of NIAS (Approval number: NIAS 20212219) and the Animal Ethics Committee of Chungnam National University (Approval number: 202209A-CNU-141).
For phenotype data collection, we used nuclear magnetic resonance spectroscopy to measure 12 FAA (alanine, asparagine, aspartic acid, glutamate, glutamine, glycine, isoleucine, leucine, methionine, phenylalanine, tyrosine, valine), 2 peptide (anserine, carnosine), 3 organic acid (acetate, creatine, lactate), and 3 NT (hypoxanthine, IMP, inosine) contents in the breast meat samples (Kim et al., 2021). The measured TAC values were calculated in units of mM. Additionally, CW was measured from each bird after slaughter. For the outlier trimming, values that were larger or smaller than three standard deviations from the mean value of the data were removed. Finally, from 817 to 828 samples across 21 traits including TAC contents and CW were filtered and used in variance component analysis. R software v 3.6.3 was used for preprocessing (Table 1).
Table 1. Descriptive statistics of phenotype measured from KNC-R population.
| Trait | Category | Mean | SD | Min | Max | N |
|---|---|---|---|---|---|---|
| CW | CW | 677.977 | 136.936 | 358 | 1135 | 824 |
| Alanine | FAA | 1.195 | 0.262 | 0.520 | 1.984 | 820 |
| Asparagine | FAA | 0.401 | 0.297 | 0.011 | 1.543 | 819 |
| Aspartic acid | FAA | 0.63 | 0.249 | 0.164 | 1.458 | 817 |
| Glutamate | FAA | 0.874 | 0.267 | 0.308 | 1.743 | 817 |
| Glutamine | FAA | 1.137 | 0.451 | 0.341 | 2.49 | 828 |
| Glycine | FAA | 1.266 | 0.660 | 0.316 | 3.305 | 826 |
| Isoleucine | FAA | 0.235 | 0.097 | 0.045 | 0.535 | 822 |
| Leucine | FAA | 0.678 | 0.210 | 0.24 | 1.345 | 822 |
| Methionine | FAA | 0.306 | 0.222 | 0.07 | 1.032 | 819 |
| Phenylalanine | FAA | 0.222 | 0.071 | 0.067 | 0.447 | 822 |
| Tyrosine | FAA | 0.523 | 0.201 | 0.117 | 1.153 | 824 |
| Valine | FAA | 0.331 | 0.127 | 0.088 | 0.729 | 823 |
| Anserine | Peptide | 29.457 | 3.819 | 17.956 | 40.547 | 818 |
| Carnosine | Peptide | 11.065 | 3.040 | 1.85 | 20.437 | 825 |
| Acetate | Organic acid | 0.315 | 0.109 | 0.057 | 0.664 | 819 |
| Creatine | Organic acid | 25.142 | 2.972 | 15.41 | 35.157 | 817 |
| Lactate | Organic acid | 83.809 | 11.293 | 47.342 | 120.123 | 818 |
| Hypoxanthine | NT | 0.433 | 0.210 | 0.096 | 1.532 | 827 |
| IMP | NT | 5.046 | 0.930 | 2.318 | 7.854 | 823 |
| Inosine | NT | 1.197 | 0.418 | 0.178 | 2.422 | 822 |
KNC-R, Korean native chicken red brown line; Min, Minimum; Max, Maximum; N, Number of samples used for analysis; CW; Carcass weight; FAA, Free amino acid; NT, Nucleotide-related compound; IMP, Inosine 5′-monophosphate
Genomic DNA was extracted from blood samples using a commercial extraction kit (GeNet Bio, Daejeon, Korea). Genotyping was conducted using the Illumina chicken 60K SNP chip (Illumina Inc., San Diego, CA, USA), generating a dataset of 57,636 SNPs from the extracted DNA. Quality control was performed with PLINK 1.9 software (v1.90b5.2) (Purcell et al., 2007), removing SNPs with a call rate below 0.9, minor allele frequency under 0.01, or a Hardy-Weinberg equilibrium p-value of less than 10−6. After filtering, 44,638 variants remained and were included in the subsequent association analysis.
Genetic parameter estimation was conducted using the BLUPF90+ software with the EM REML algorithm. To accurately estimate variance components, sex and experimental batch were included as covariates in the model. A multi-trait genomic model was applied to capture genetic correlations among traits, thereby enhancing the precision of parameter estimates.
For this multi-trait model, genomic data were used to create the genomic relationship matrix (G), following VanRaden’s method:
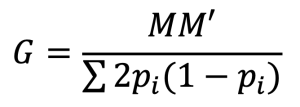
, where M represents the matrix of centered genotypes, and pi is the allele frequency at locus i. The estimation of additive genetic variance and residual variance was recorded in the log file (VanRaden, 2008). Heritability (h2) for each trait was calculated as the proportion of genetic variance (σ2g) to the total variance (sum of genetic and residual variances), based on the formula:
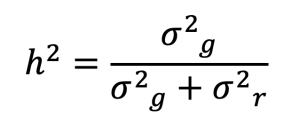
, where h2 denotes heritability of a trait, σ2g is the genetic variance, and σ2r is the residual variance. This process enabled the estimation of heritability values for various TAC and CW traits in the KNC-R population.
To assess the relationships among traits, genetic correlations were calculated. These correlations provide insights into shared genetic influences among traits. Genetic correlations (rg) were derived from the covariance between traits as follows:
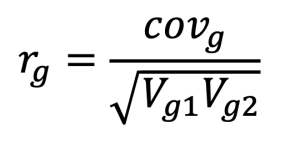
, where rg represents the genetic correlation, covg is the genetic covariance between two traits, and Vg1 and Vg2 denote the genetic variances of traits 1 and 2, respectively.
The descriptive statistics for the phenotypic values of TAC traits, including FAAs, peptides, organic acids, and NTs, in the KNC-R chicken population are presented in Table 1. Histograms and quantile-quantile (Q-Q) plots illustrating the distributions of these traits are displayed in Fig. 1. In this population, the mean values of FAA phenotypes such as alanine and leucine were 1.195 and 0.678 mM, respectively. Among the FAAs, valine exhibited a relatively narrow range (0.102-0.729 mM), whereas glycine had a wider range (0.316-3.305 mM), reflecting the variability of these amino acids in the population. Regarding NTs, inosine showed a mean of 1.197 mM with a range from 0.178 to 2.422 mM, while IMP exhibited a higher mean of 5.046 mM, with values ranging from 2.318 to 7.854 mM. For organic acids, lactate displayed the highest mean value at 83.809 mM, ranging from 43.342 to 120.123 mM, indicating its prominent presence among organic acid compounds in KNC-R breast meat. Peptides like anserine and carnosine also exhibited considerable mean values, with anserine reaching 29.457 mM and carnosine averaging 11.065 mM. The histograms and Q-Q plots in Fig. 1 illustrate the normality of trait distributions. Traits such as carnosine and inosine show distributions close to normal, while others like acetate exhibit slight deviations.
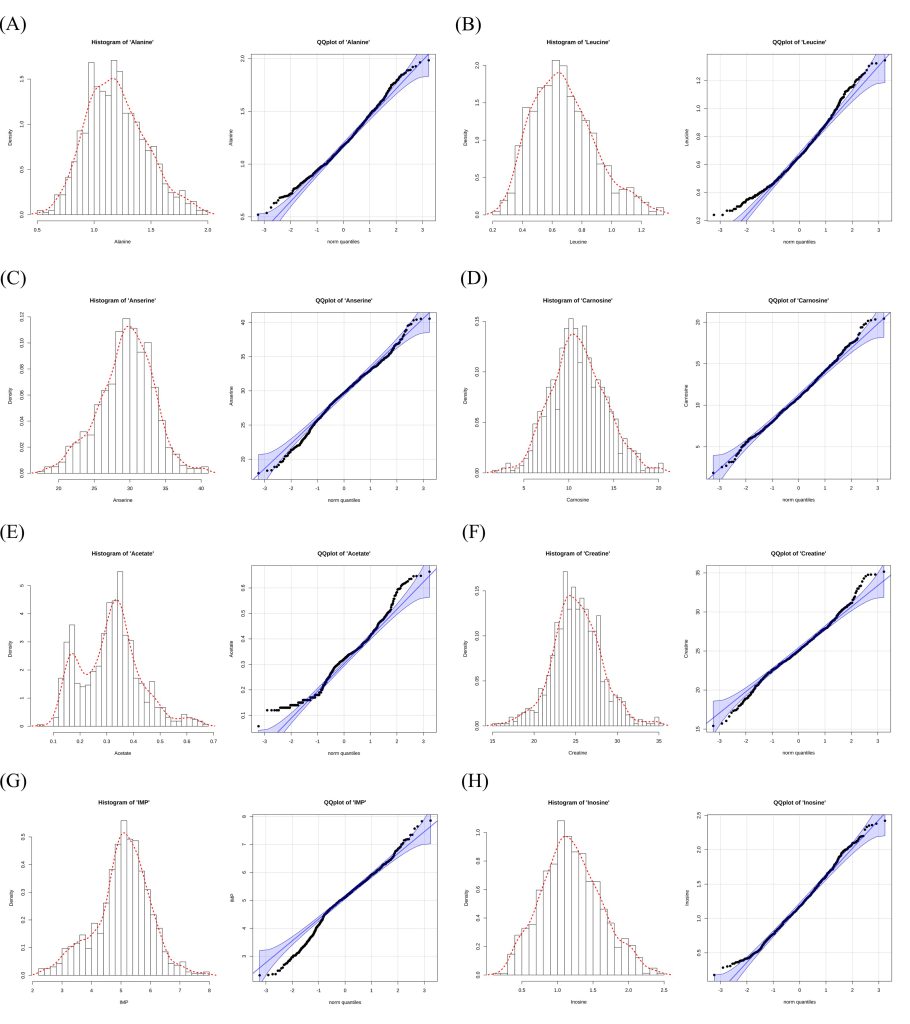
Figure 1. Histogram and quantile-quantile plot of taste-active compound data. (A) Alanine, (B) Leucine, (C) Anserine, (D) Carnosine, (E) Acetate, (F) Creatine, (G) Inosine 5*-monophosphate (IMP) (H) Inosine.
Table 2 presents the heritability estimates and variance components for various TAC traits in the KNC-R chicken population. Overall, the heritability estimates for most FAA, peptide, organic acid, and NT traits were moderate, indicating that both genetic and environmental factors contribute to the observed phenotypic variance. For FAAs, alanine and asparagine exhibited the highest heritability at 0.27, suggesting a relatively stronger genetic influence on these traits. Other FAAs such as glutamate, glutamine, isoleucine, leucine, phenylalanine, and valine showed heritability estimates ranging from 0.18 to 0.21, highlighting their moderate genetic variance within this population. Among the peptide traits, carnosine displayed a heritability of 0.34. Anserine, another peptide, showed a lower heritability of 0.17. For organic acids, acetate, creatine, and lactate had heritability values of 0.12, 0.13, and 0.16, respectively. NTs, including hypoxanthine, IMP, and inosine, demonstrated heritability estimates between 0.24 and 0.45. Notably, inosine had the highest heritability at 0.45 among all analyzed TAC traits, suggesting a strong genetic component in its phenotypic variance. The NT traits tended to have higher heritability values compared to other categories in TAC, while organic acids displayed the lowest heritability estimates.
Table 2. Estimated heritabilities and variance components of taste-active compound and carcass weight (CW) traits.
| Trait | Category | σ2a | σ2r | h2 |
|---|---|---|---|---|
| CW | CW | 2973.5 | 3977.6 | 0.43 |
| Alanine | FAA | 0.016 | 0.043 | 0.27 |
| Asparagine | FAA | 0.008 | 0.022 | 0.27 |
| Aspartic acid | FAA | 0.003 | 0.024 | 0.11 |
| Glutamate | FAA | 0.006 | 0.025 | 0.20 |
| Glutamine | FAA | 0.009 | 0.038 | 0.20 |
| Glycine | FAA | 0.014 | 0.096 | 0.13 |
| Isoleucine | FAA | 0.001 | 0.004 | 0.21 |
| Leucine | FAA | 0.005 | 0.025 | 0.18 |
| Methionine | FAA | 0.001 | 0.004 | 0.15 |
| Phenylalanine | FAA | 0.001 | 0.003 | 0.18 |
| Tyrosine | FAA | 0.003 | 0.016 | 0.14 |
| Valine | FAA | 0.001 | 0.006 | 0.18 |
| Anserine | Peptide | 1.715 | 8.459 | 0.17 |
| Carnosine | Peptide | 2.181 | 4.282 | 0.34 |
| Acetate | Organic acid | 0.001 | 0.005 | 0.12 |
| Creatine | Organic acid | 0.895 | 5.995 | 0.13 |
| Lactate | Organic acid | 13.395 | 68.724 | 0.16 |
| Hypoxanthine | NT | 0.005 | 0.017 | 0.24 |
| IMP | NT | 0.105 | 0.327 | 0.24 |
| Inosine | NT | 0.066 | 0.080 | 0.45 |
σ2a, Estimated genetic variance of the trait; σ2r, Estimated residual variance of the trait; h2, Estimated heritability; CW, Carcass weight; FAA, Free amino acid; NT, Nucleotide-related compound; IMP, Inosine 5′-monophosphate
The genetic and phenotypic correlations among the TAC traits reveal distinct patterns within and across these trait categories (Fig. 2). Within the FAA category, alanine showed a strong positive genetic correlation with phenylalanine (0.65) and methionine (0.53), while methionine and leucine also demonstrated a high correlation (0.68). Additionally, glutamate displayed moderate to high positive genetic correlations with isoleucine (0.55), leucine (0.74), and methionine (0.67). Carnosine, a peptide, exhibited a negative genetic correlation with anserine (-0.59). For organic acids, creatine and lactate showed positive genetic correlation (0.59). For NTs, inosine and hypoxanthine displayed a strong positive genetic correlation (0.63). Whereas, inosine showed strong negative genetic correlation with IMP (-0.71). Notably, across different TAC categories, acetate, an organic acid, exhibited moderate genetic correlations with alanine (0.52) and phenylalanine (0.56), isoleucine (0.60) and glutamate (0.53) from the FAA category. Lactate showed moderate positive correlations with tyrosine (0.571). Creatine exhibited negative correlation with asparagine (-0.58) from FAA trait. Hypoxanthine, an NT trait, displayed a positive genetic correlation with glutamate (0.57) from the FAA category. In terms of phenotypic correlations, alanine and phenylalanine showed a moderate positive correlation (0.52), as did glutamate and glutamine (0.54). Among the NTs, inosine and hypoxanthine also exhibited a high positive correlation (0.50), indicating a consistent relationship in both genetic and phenotypic dimensions. Inosine and IMP showed moderate negative phenotypic correlation (-0.31). CW showed a mild negative correlation with acetate (-0.44), phenylalanine (-0.34), and IMP (-0.33). Whereas, CW generally showed weak phenotypic correlations with TAC traits.
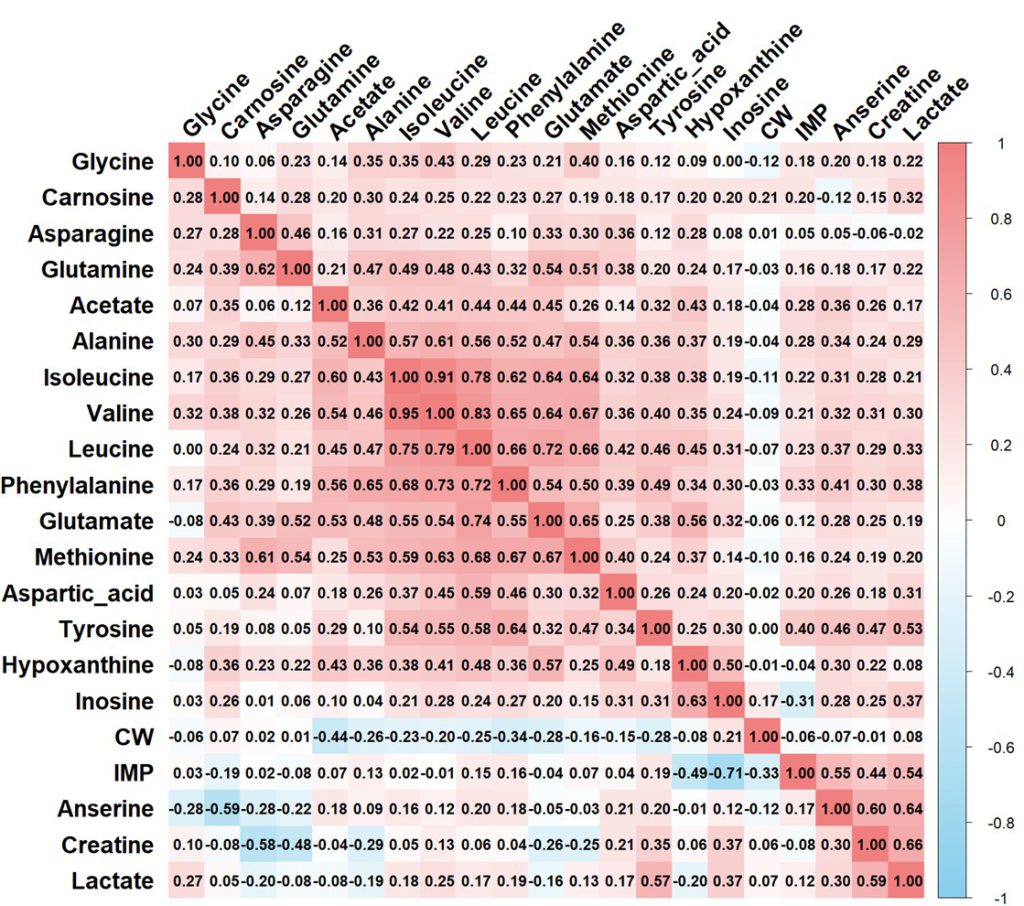
Figure 2. Genetic and phenotypic correlation of taste-active compound and carcass weight (CW) traits. Genetic correlations are shown in the lower diagonal, while phenotypic correlations are shown in the upper diagonal.
In this study, we analyzed the heritability and genetic correlations of CW and TAC in the breast meat of the KNC-R line, focusing on FAAs, peptides, organic acids, and NTs. The results revealed a complex genetic architecture underlying these compounds, with notable variability in heritability estimates across different TAC categories. The heritability values for FAAs were generally moderate in this research, with alanine and asparagine showing the highest values (0.27). This aligns with previous study indicating that free amino acids in skeletal muscle involved in protein metabolism tend to be easily affected by nutritional condition for broiler (Watanabe et al., 2020). In that study, low dietary lysine levels were reported to increase protease expression, leading to the release of FAAs in muscle tissue. Additionally, muscle FAA content in poultry has been shown to vary in response to environmental effects, such as protein metabolism induced by heat stress (Qaid and Al-Garadi, 2021).
In the results, the peptides anserine and carnosine displayed heritability estimates of 0.17 and 0.34, respectively, with carnosine exhibiting one of the highest heritability among TAC traits. Histidine-containing dipeptides like anserine and carnosine are known for their antioxidant properties in muscle tissue, and studies suggest that their concentrations in muscle may be genetically influenced due to their roles in pH buffering and antioxidation in animals, including chickens. These dipeptides help delay muscle acidification during anaerobic metabolism, where lactate and hydrogen ions accumulate, thereby stabilizing muscle pH under conditions of metabolic stress (Dolan et al., 2018; Baldi et al., 2021). This buffering role may explain the moderate heritability observed for peptide traits.
Lactate, an organic acid, is produced in skeletal muscle during high-intensity exercise through anaerobic metabolism. Its levels can fluctuate as it is further utilized as an energy source (Gladden, 2004). Creatine, on the other hand, tends to decrease with intense muscle activity, as it is consumed for ATP production (Casey and Greenhaff, 2000). Acetate levels can also vary based on muscle energy demands; during active metabolism, fatty acids and amino acids break down to form acetyl-CoA, which may then convert to acetate (Wolfe, 1998; Foster, 2004). Given these dynamics, individual differences in activity levels likely influenced the phenotypic value of organic acid traits, contributing to the lower genetic variance observed in these traits.
The NT traits IMP, inosine, and hypoxanthine are products of the purine metabolism pathway, where ATP is broken down to supply energy for muscle tissue. In chicken muscle, both the synthesis and degradation of IMP, inosine, and hypoxanthine are regulated by several metabolic enzymes. Genes encoding these enzymes, such as Glutamine-PRPP amidotransferase (GPAT), Adenylosuccinate lyase (ADSL), and Aminoimidazole ribonucleotide carboxylase (AIRC), have been previously identified as markers associated with individual variation (Huang et al., 2022). In the present study, inosine demonstrated notably high heritability, indicating a substantial genetic influence on its concentration. This finding may suggest a significant genetic effect on 5′-nucleotidase, the enzyme responsible for degrading IMP to inosine.
We observed distinct genetic and phenotypic correlations within and across the TAC traits in the KNC-R chicken population, reflecting their underlying metabolic relationships. Within the FAA category, several strong positive genetic correlations were identified, such as between alanine and phenylalanine (0.65) and between methionine and leucine (0.68). These correlations suggest that these amino acids share a common genetic basis, likely due to their interconnected roles in amino acid metabolism. For instance, the metabolic link between branched-chain amino acids, like leucine, isoleucine, and valine, is well-documented and supported by shared enzymes in their synthesis and degradation pathways (Harris et al., 2005; Wu, 2009). Additionally, glutamate’s moderate to high positive genetic correlations with amino acids like leucine (0.74) and methionine (0.67) align with its role as a central amino acid in nitrogen transport and amino acid biosynthesis (Temple et al., 1998; Watford, 2015). In the peptide category, anserine and carnosine showed a negative genetic correlation (-0.59). Based on the chicken Kyoto Encyclopedia of Genes and Genomes (KEGG) database, in the histidine metabolism pathway (gga00340) describe how carnosine convert to anserine (Kim et al., 2024). The observed negative correlation suggests that these dipeptides synthesis may be regulated in opposing ways, perhaps due to physiological trade-offs in muscle tissue. For organic acids, creatine and lactate exhibited a moderate positive genetic correlation (0.59), indicating co-regulation within energy metabolism in muscle tissue. Lactate is produced during anaerobic metabolism, while creatine serves as an immediate energy reserve. The positive correlation may reflect their combined role in energy production and utilization under high metabolic demands (Gladden, 2004). Additionally, acetate’s moderate genetic correlations with several FAAs, such as alanine (0.52) and phenylalanine (0.56), indicate potential metabolic links between amino acid and organic acid pathways. Acetate, as a derivative of acetyl-CoA in active metabolism, may interact with amino acid catabolism, aligning with findings in prior studies (Foster, 2004). In the NT category, inosine and hypoxanthine displayed a strong positive genetic correlation (0.63), consistent with their sequential roles in purine degradation. The negative genetic correlation observed between inosine and IMP (-0.71) highlights the metabolic flux in purine pathways, where the accumulation of one compound can lead to the depletion of another, as each compound represents a step in ATP degradation (Huang et al., 2022).
The phenotypic correlations generally followed the genetic trends but with some differences in magnitude, likely due to environmental influences. Inosine and hypoxanthine displayed a moderate positive phenotypic correlation (0.50), consistent with their shared metabolic pathway. The moderate negative phenotypic correlation observed between CW and TAC traits like acetate (-0.44) and phenylalanine (-0.34) suggests that larger carcass size may be associated with reduced concentrations of specific TACs, potentially reflecting metabolic shifts in larger birds. Given the observed correlations, breeding strategies aimed at increasing CW in meat-type chickens should carefully consider the traits that display negative correlations with CW. Specifically, TACs, which showed moderate negative phenotypic correlations with CW, may be influenced in ways that could impact the flavor profile if CW is significantly increased. Increasing CW without accounting for these negative correlations could lead to a reduction in certain flavor-related compounds, potentially affecting meat taste.
This study provides foundational insights into the genetic architecture of TAC traits in the KNC-R chicken line, offering direction for breeding strategies aimed at enhancing both growth and flavor. The moderate heritability values for FAAs, peptides, organic acids, and NTs suggest potential for genetic selection, though environmental influences remain significant. Inosine and carnosine, with higher heritability, emerge as promising targets for flavor enhancement. However, the negative correlations observed between CW and specific TACs, such as acetate and phenylalanine, imply that increasing carcass weight could impact flavor. Thus, a balanced breeding approach is recommended to maintain both carcass yield and the distinct flavor profile of KNC-R chicken meat.
No potential conflict of interest relevant to this article is reported.
This study was financially supported by the project funding number: RS-2021-RD010125 (PJ016205) of the Rural Development Administration, South Korea.
Baldi G, Soglia F, Laghi L, Meluzzi A, Petracci M. 2021. The role of histidine dipeptides on postmortem acidification of broiler muscles with different energy metabolism. Poultry Science. 100(2): 1299-307.
[DOI][PubMed][PMC]
Bryant C, Barnett J. 2020. Consumer Acceptance of Cultured Meat: An Updated Review (2018〝2020). Applied Sciences. 10(15): 5201.
[DOI]
Bryant C, Szejda K, Parekh N, Deshpande V, Tse B. 2019. A survey of consumer perceptions of plant-based and clean meat in the USA, India, and China. Frontiers in Sustainable Food Systems. 3432863.
[DOI]
Casey A, Greenhaff PL. 2000. Does dietary creatine supplementation play a role in skeletal muscle metabolism and performance? The American Journal of Clinical Nutrition. 72(2): 607S-17S.
[DOI][PubMed]
Choe J-H, Nam K-C, Jung S, Kim B-N, Yun H-J, Jo C-R. 2010. Differences in the quality characteristics between commercial Korean native chickens and broilers. Food Science of Animal Resources. 30(1): 13-9.
[DOI]
Choi NR, Seo DW, Jemaa SB, Sultana H, Heo KN, Jo C, Lee JH. 2015. Discrimination of the commercial Korean native chicken population using microsatellite markers. Journal of Animal Science and Technology. 57(1): 5.
[DOI][PubMed][PMC]
Chumngoen W, Tan F-J. 2015. Relationships between Descriptive Sensory Attributes and Physicochemical Analysis of Broiler and Taiwan Native Chicken Breast Meat. Asian-Australas Journal of Animal Science. 28(7): 1028-37.
[DOI][PubMed][PMC]
Dashdorj D, Amna T, Hwang I. 2015. Influence of specific taste-active components on meat flavor as affected by intrinsic and extrinsic factors: An overview. European Food Research and Technology. 241157-71.
[DOI]
Dolan E, Saunders B, Dantas W, Murai I, Roschel H, Artioli G, Harris R, Bicudo J, Sale C, Gualano B. 2018. A Comparative Study of Hummingbirds and Chickens Provides Mechanistic Insight on the Histidine Containing Dipeptide Role in Skeletal Muscle Metabolism. Scientific Reports. 8(1): 14788.
[DOI][PubMed][PMC]
Foster DW. 2004. The Role of the Carnitine System in Human Metabolism. Annals of the New York Academy of Sciences. 1033(1): 1-16.
[DOI][PubMed]
Gladden LB. 2004. Lactate metabolism: a new paradigm for the third millennium. The Journal of Physiology. 558(1): 5-30.
[DOI][PubMed][PMC]
Graça J, Calheiros MM, Oliveira A. 2014. Moral Disengagement in Harmful but Cherished Food Practices? An Exploration into the Case of Meat. Journal of Agricultural and Environmental Ethics. 27(5): 749-65.
[DOI]
Harris RA, Joshi M, Jeoung NH, Obayashi M. 2005. Overview of the Molecular and Biochemical Basis of Branched-Chain Amino Acid Catabolism. The Journal of Nutrition. 135(6): 1527S-30S.
[DOI][PubMed]
Henchion M, Moloney AP, Hyland J, Zimmermann J, McCarthy S. 2021. Review: Trends for meat, milk and egg consumption for the next decades and the role played by livestock systems in the global production of proteins. Animal. 15100287.
[DOI][PubMed]
Huang Z, Zhang J, Gu Y, Cai Z, Feng X, Yang C, Xin G. 2022. Research progress on inosine monophosphate deposition mechanism in chicken muscle. Critical Reviews in Food Science and Nutrition. 62(4): 1062-78.
[DOI][PubMed]
Jayasena DD, Jung S, Kim HJ, Bae YS, Yong HI, Lee JH, Kim JG, Jo C. 2013. Comparison of Quality Traits of Meat from Korean Native Chickens and Broilers Used in Two Different Traditional Korean Cuisines. Asian-Australas Journal of Animal Science. 26(7): 1038-46.
[DOI][PubMed][PMC]
Jayasena DD, Jung S, Kim HJ, Yong HI, Nam KC, Jo C. 2015. Taste-active compound levels in Korean native chicken meat: The effects of bird age and the cooking process. Poultry Science. 94(8): 1964-72.
[DOI][PubMed]
Jayasena DD, Kim SH, Lee HJ, Jung S, Lee JH, Park HB, Jo C. 2014. Comparison of the amounts of taste-related compounds in raw and cooked meats from broilers and Korean native chickens. Poultry Science. 93(12): 3163-70.
[DOI][PubMed]
Jin S, Jayasena D, Jo C, Lee J. 2017. The breeding history and commercial development of the Korean native chicken. World’s Poultry Science Journal. 73(1): 163-74.
[DOI]
Jung S, Bae YS, Kim HJ, Jayasena DD, Lee JH, Park HB, Heo KN, Jo C. 2013. Carnosine, anserine, creatine, and inosine 5﹊-monophosphate contents in breast and thigh meats from 5 lines of Korean native chicken. Poultry Science. 92(12): 3275-82.
[DOI][PubMed]
Jung S, Bae YS, Yong HI, Lee HJ, Seo DW, Park HB, Lee JH, Jo C. 2015. Proximate Composition, and L-Carnitine and Betaine Contents in Meat from Korean Indigenous Chicken. Asian-Australas Journal of Animal Science. 28(12): 1760-6.
[DOI][PubMed][PMC]
Kim HC, Yim D-G, Kim JW, Lee D, Jo C. 2021. Nuclear Magnetic Resonance (NMR)-Based Quantification on Flavor-Active and Bioactive Compounds and Application for Distinguishment of Chicken Breeds. Food Science of Animal Resources. 41(2): 312-23.
[DOI][PubMed][PMC]
Kim M, Cho E, Cho S, Choo H, Jin D, Lee J. 2022. A study on the conservation status of Korean native chicken populations. J. Anim. Breed. Genom. 6135-42.
Kim M, Munyaneza JP, Cho E, Jang A, Jo C, Nam K-C, Choo HJ, Lee JH. 2024. Genome-wide association studies of anserine and carnosine contents in the breast meat of Korean native chickens. Poultry Science. 103(5): 103590.
[DOI][PubMed][PMC]
Marangoni F, Corsello G, Cricelli C, Ferrara N, Ghiselli A, Lucchin L, Poli A. 2015. Role of poultry meat in a balanced diet aimed at maintaining health and wellbeing: an Italian consensus document. Food & Nutrition Research. 59(1): 27606.
[DOI][PubMed][PMC]
Ono T, Kouguchi T, Ishikawa A, Nagano AJ, Takenouchi A, Igawa T, Tsudzuki M. 2019. Quantitative trait loci mapping for the shear force value in breast muscle of F2chickens. Poultry Science. 98(3): 1096-101.
[DOI][PubMed]
Outlook FAO. 2013. OECD/Food and Agriculture Organization of United Nations. OECD Publishing.
Purcell S, Neale B, Todd-Brown K, Thomas L, Ferreira MA, Bender D, Maller J, Sklar P, De Bakker PI, Daly MJ. 2007. PLINK: a tool set for whole-genome association and population-based linkage analyses. The American journal of human genetics. 81(3): 559-75.
[DOI][PubMed][PMC]
Qaid MM, Al-Garadi MA. 2021. Protein and Amino Acid Metabolism in Poultry during and after Heat Stress: A Review. Animals. 11(4): 1167.
[DOI][PubMed][PMC]
Seo D, Park H-B, Jung S, Manjula P, Choi N, Jin S, Heo K-N, Jo C, Gotoh T, Lee JH. 2016. Association of HSPB1 and CRYAB SNPs with chicken meat quality and robustness in five lines of Korean native chicken. Journal of the Faculty of Agriculture, Kyushu University. 61(1): 127-32.
[DOI]
Seo JH, Lee JH, Kong HS. 2017. Assessment of genetic diversity and phylogenetic relationships of Korean native chicken breeds using microsatellite markers. Asian-Australas Journal of Animal Science. 30(10): 1365-71.
[DOI][PubMed][PMC]
Shu J-T, Chen G-H, Han W, Zhang X-Y. 2010. Analysis of the Genetic Effects of Three Single Nucleotide Polymorphisms on Inosine Monophosphate Content in Chinese Baier Chicken. Avian Biology Research. 3(2): 75-80.
[DOI]
Sun Y, Zhao G, Liu R, Zheng M, Hu Y, Wu D, Zhang L, Li P, Wen J. 2013. The identification of 14 new genes for meat quality traits in chicken using a genome-wide association study. BMC Genomics. 14(1): 458.
[DOI][PubMed][PMC]
Temple SJ, Vance CP, Stephen Gantt J. 1998. Glutamate synthase and nitrogen assimilation. Trends in Plant Science. 3(2): 51-6.
[DOI]
Thornton PK. 2010. Livestock production: recent trends, future prospects. Philosophical Transactions of the Royal Society B: Biological Sciences. 365(1554): 2853-67.
[DOI][PubMed][PMC]
VanRaden, P. M. 2008. Efficient methods to compute genomic predictions. Journal of Dairy Science, 91(11): 4414-4423
[DOI][PubMed]
Watanabe G, Kobayashi H, Shibata M, Kubota M, Kadowaki M, Fujimura S. 2020. Reduction in dietary lysine increases muscle free amino acids through changes in protein metabolism in chickens. Poultry Science. 99(6): 3102-10.
[DOI][PubMed][PMC]
Watford M. 2015. Glutamine and glutamate: Nonessential or essential amino acids? Animal Nutrition. 1(3): 119-22.
[DOI][PubMed][PMC]
Wolfe RR. 1998. Metabolic interactions between glucose and fatty acids in humans. The American Journal of Clinical Nutrition. 67(3): 519S-26S.
[DOI][PubMed]
Wu G. 2009. Amino acids: metabolism, functions, and nutrition. Amino Acids. 37(1): 1-17.
[DOI][PubMed]