Correspondence to Seung Hwan Lee, E-mail: slee46@cnu.ac.kr
Volume 9, Number 2, Pages 95-103, June 2025.
Journal of Animal Breeding and Genomics 2025, 9(2), 95-103. https://doi.org/10.12972/jabng.2025.9.2.5
Received on January 21, 2025, Revised on June 25, 2025, Accepted on June 30, 2025, Published on June 30, 2025.
Copyright © 2025 Korean Society of Animal Breeding and Genetics.
This is an Open Access article distributed under the terms of the Creative Commons Attribution Non-Commercial License (http://creativecommons.org/licenses/by-nc/4.0).

This study aimed to estimate growth curve parameters in Hanwoo cattle using nonlinear models. Body weight records were collected from the Hanwoo Research Center, the Nonghyup Hanwoo Improvement Center, and commercial farms. Animals were categorized by sex and feeding system, and growth was modeled using Gompertz, Richards, and von Bertalanffy equations.For breeding cows, estimated mature weights were 416.4±1.4 kg (1980s), 451.5±1.5 kg (1990s), and 442.7±1.4 kg (2000s) with the Gompertz model; 488.0±4.2 kg, 497.7±3.0 kg, and 484.6±2.2 kg with the Richards model; and 426.5±1.5 kg, 462.3±1.6 kg, and 451.3±1.4 kg with the von Bertalanffy model. For fattening heifers, mature weights were 756.5±9.0 kg (Gompertz), 782.3±20.0 kg (Richards), and 816.5±12.3 kg (von Bertalanffy). In bulls, mature weights at the Hanwoo Research Center were 801.2±7.3 kg (Gompertz), 892.6±19.7 kg (Richards), and 905.5±10.7 kg (von Bertalanffy); at the Improvement Center, they were 563.0±7.4 kg and 612.5±10.1 kg using Gompertz and von Bertalanffy, respectively. For steers, estimates from Gompertz and von Bertalanffy were 893.2±10.4 kg and 1065.0±17.3 kg (Research Center), 1046.2±11.2 kg and 1285.5±20.8 kg (Improvement Center), and 903.3±13.6 kg and 1037.2±21.4 kg (farm). Richards model parameters were often not estimable in certain subgroups. Overall, the von Bertalanffy model showed the best overall fit and stability, making it the most suitable model for describing Hanwoo growth and supporting breeding and management strategies.
Hanwoo, Weight, Growth curve parameter
전 세계적으로 종자와 가축 유전 자원은 생물다양성과 식량안보 측면에서 점차 그 중요성이 부각되고 있으며, 우리나라 고유 품종인 한우는 국가적·농업적 가치 측면에서 매우 중요한 유전자원으로 평가된다. 한우는 근내지방 함량이 높아 고급육으로서의 시장 경쟁력이 뛰어나고, 한국 소비자의 기호에도 잘 부합하는 품질 특성을 지니고 있다.
1990년대 이후 농업의 기계화와 소비 트렌드 변화에 따라 한우의 사육 목적은 과거의 역용 중심에서 고기 생산 중심으로 전환되었고, 이에 따라 성장 및 육질 형질에 대한 체계적인 개량이 본격적으로 이루어졌다. 특히 2000년대 초반 이후부터는 근내지방 함량을 중심으로 한 육질 개량이 집중되면서, 거세우의 1등급 이상 출현율은 약 85%까지 향상되는 성과를 거두었다.
그러나 이러한 개량 성과에도 불구하고, 한우는 외국 육우 품종에 비해 이유 체중이 낮고 성장 속도가 느리다는 한계가 보고된 바 있으며(조, 2000; 김 등, 2002), 성장 특성에 대한 표준화된 정량 연구는 부족한 실정이다. 체중은 산육 능력을 나타내는 대표적인 경제 형질로서 한우의 당대검정과 유전 능력 평가에서 핵심 지표로 활용되어 왔고(Park 등, 2013), 특히 최근에는 과거 번식용으로만 활용되던 암소, 그 중 미경산우가 비육우로 활용되는 사례가 증가하고 있어, 이들의 성장 양상을 다양한 사육 환경 속에서 정밀하게 분석하는 것은 한우 산업에서 중요한 과제로 부상하고 있다.
성장곡선 분석은 개체의 생애 주기 전반에 걸친 체중 기록을 바탕으로 비선형 수학 모형을 적용하여 성장 특성을 정량화하는 방법으로, 성장률과 성숙체중뿐만 아니라 기록이 없는 시점의 체중까지도 예측할 수 있다는 장점이 있다(Winsor, 1932; Richards, 1959; von Bertalanffy, 1957). Jersey, Hereford 등 외국 육우 품종을 대상으로 일령 별 체중 자료를 활용한 성장곡선 분석과 그 변이를 분석한 연구들이 보고된 바 있으며 (Brown 등, 1976), 국내에서도 한우에 대한 일부 연구가 진행된 바 있다(이 등, 2003; 조 등, 2006; 최 등, 2008). 그러나 이들 연구는 대부분 거세우에 한정되거나 제한된 사육 조건을 기반으로 하고 있어, 암소를 포함하고 다양한 사양 환경을 반영한 연구는 여전히 부족하다.
이에 본 연구는 한우 암소(번식우 및 미경산 비육우)와 수소(거세우 및 비거세우)를 대상으로 생애 체중 자료를 활용하여 성장곡선 모수를 추정하고, 성별, 사양 형태, 출생 시기 등에 따른 성장 특성의 차이를 분석하고자 수행 하였다.
본 자료는 국립축산과학원 한우연구센터에서 1980년대부터 사육되어온 한우의 전 생애의 발육 기록과 농협 한우개량사업소의 당대 검정우 발육 기록, 평창 지역 대관령 한우 농가에서 사육된 한우의 발육 기록 중 연속된 기록이 있는 개체를 포함하여 58개 지역 4,083두의 체중 자료 45,164건으로 구성되었다. 수집된 자료는 성별과 사양 방법에 따라 암소는 번식우와 미경산 비육우, 수소는 비거세우와 거세우로 총 4개의 그룹으로 나눈 뒤 출생 년도에 따라 5년, 10년 단위로 분리하여 성장 특성을 분석하였다.
국내에서 반복 측정된 체중 자료를 기반으로 한우 암소 및 거세우의 성장특성에 대한 보고가 다수 있으나(이 등, 2003; 조 등, 2006; 최 등, 2008) 최근 암소 미경산 비육우 및 비거세우 및 거세비육우에 대한 표준을 새롭게 제시하기 위하여 분석을 수행하였다. 한우의 성장특성을 분석하기 위하여 3개의 비선형모형 즉 Gompertz 모형(Winsor, 1932), Richards모형(Richard, 1959), von Bertalanffy(von bertalanffy, 1957) 모형을 이용하여 한우암소 및 거세우의 성장곡선 모수를 추정하였다. 성장곡선의 모형을 구하기 위해 사용한 Gompertz 모형의 함수식은 다음과 같다.
$$W_t = A e^{-b e^{-kt}}$$
여기에서, Wt는 t 시점의 체중, A는 초기 체중에 대한 모수, b는 출생 시점에서 시작하여 어떤 위치에서 성장하는지를 조절하는 성장비, k는 성장 속도를 결정하는 성숙률에 대한 모수이다. Richards 모형은 아래의 함수식으로 표현할 수 있다.
$$W_t = A \left(1 – b e^{-kt} \right)^M$$
여기에서, Wt는 t 시점의 체중, A는 초기 체중에 대한 모수, b는 성장비, k는 성숙률에 대한 모수 그리고 M은 변곡점 조절 모수, e는 지수를 나타낸다. Von Bertalanffy 모형의 경우는
$$W_t = A \left(1 – b e^{-kt} \right)^3$$
과 같으며 여기에서, Wt는 t 시점의 체중, A는 초기 체중에 대한 모수, b는 성장비, k는 성숙률에 대한 모수 그리고 e는 지수를 나타낸다.
비선형 회귀식을 구하기 위해 사용한 함수는 Gauss-Neton법을 적용한 SAS(1998)의 Proc NLIN이었고, 편도함수의 지정이 필요하지 않은 탐색기법에는 DUD(Doesn’t Use Derivaive)방법을 이용하였다. 추정된 모수에 대해서는 잔차평균제곱(RMS)에 근거하여 가장 적합한 모형을 선정하였다. 표준 체중 산출을 위한 최적 알고리듬은 각 분류군별 자료를 이용하여 추정한 최적의 성장 곡선 모형으로 추정한 모수를 이용하였다.
Table 1. Estimation of growth curve parameters for breeding cows by birth period.
| Times | Model | Parameters* | RMS** | |||
|---|---|---|---|---|---|---|
| A ± SE, kg | b ± SE | k ± SE | m ± SE | |||
| 1980 ~ 1989 | Gompertz | 416.4 ± 1.4 | 2.2439 ± 0.0101 | 0.0793 ± 0.0005 | 0.8509 ± 0.0160 | 879.3 |
| Richards | 488.0 ± 4.2 | 0.9947 ± 0.0028 | 0.0309 ± 0.0010 | 769.0 | ||
| von Ber talanffy | 426.5 ± 1.5 | 0.5551 ± 0.0018 | 0.0651 ± 0.0005 | 835.5 | ||
| 1990 ~ 1999 | Gompertz | 451.5 ± 1.5 | 2.4112 ± 0.0114 | 0.0826 ± 0.0006 | 1.0840 ± 0.0258 | 1227.3 |
| Richards | 497.7 ± 3.0 | 0.9697 ± 0.0058 | 0.0420 ± 0.0010 | 1127.9 | ||
| von Ber talanffy | 462.3 ± 1.6 | 0.5862 ± 0.0021 | 0.0676 ± 0.0005 | 1176.0 | ||
| 2000 ~ 2009 | Gompertz | 442.7 ± 1.4 | 2.4472 ± 0.0157 | 0.1041 ± 0.0008 | 0.9503 ± 0.0175 | 1548.0 |
| Richards | 484.6 ± 2.2 | 1.0186 ± 0.0033 | 0.0510 ± 0.0010 | 1322.8 | ||
| von Ber talanffy | 451.3 ± 1.4 | 0.6002 ± 0.0029 | 0.0871 ± 0.0006 | 1450.8 | ||
*A: the parameter for the asymptotic limit of the weight when age(t) approaches infinity; b: the log-function for the proportion of the asymptotic mature weight to be gained after birth; k: the parameter for maturing rate, a function of the ratio of maximum growth rate to mature size; m: the parameter for breakpoint adjustment
**RMS: residual mean square
잔차평균제곱(RMS)은 Richards 모형에서 가장 적었지만, 초기 체중이 과소 추정되고 변곡점이 실제보다 빠르게 나타나는 경향을 보여 von Bertalanffy 모형이 한우 번식우의 성장 패턴을 더 정확히 설명하는 것으로 판단되었다(Figure 1). 이러한 결과는 번식우의 성장곡선을 추정함에 있어 von Bertalanffy 모형이 성장곡선 모수 추정에 있어 더 안정적인 결과를 제공한다는 것을 보여주며, 이는 다양한 환경 및 사양 조건에서의 적용 가능성을 높일 수 있음을 시사한다.
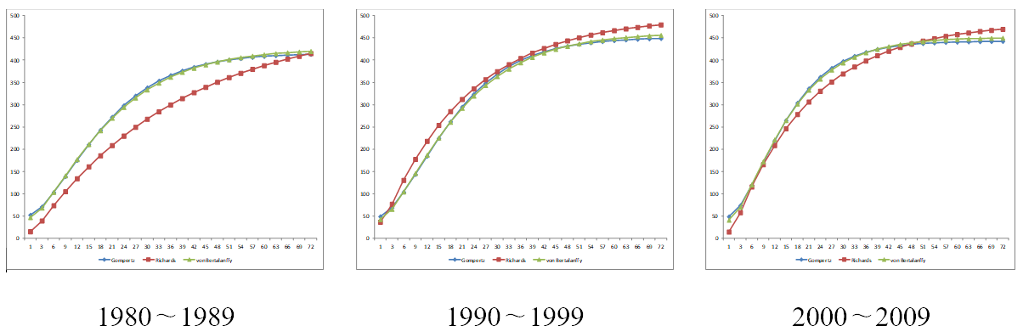
Figure 1. Comparison of growth curve for breeding cows by birth period.
2005년부터 2009년까지 출생한 암소 번식우와 미경산 비육암소의 성장곡선을 비교한 결과, 두 그룹의 성장 패턴에는 유의한 차이가 있음을 확인하였다. 번식우의 경우, Gompertz 모형에서의 성숙 체중은 455.1 ± 2.0 kg, Richards 모형에서 502.1 ± 4.0 kg, von Bertalanffy 모형에서 462.5 ± 2.0 kg로 나타났다(Table 2).
Table 2. Estimation of growth curve parameters for breeding cows born in 2005-2009.
| Model | Parameters* | RMS** | |||
|---|---|---|---|---|---|
| A ± SE, kg | b ± SE | k ± SE | m ± SE | ||
| Gompertz | 455.1 ± 2.0 | 2.4227 ± 0.0245 | 0.0968 ± 0.0011 | 0.8905 ± 0.0248 | 1886.2 |
| Richards | 502.1 ± 4.0 | 1.0172 ± 0.0039 | 0.0439 ± 0.0016 | 1615.1 | |
| von Bertalanffy | 462.5 ± 2.0 | 0.5935 ± 0.0045 | 0.0811 ± 0.0010 | 1777.0 | |
*A: the parameter for the asymptotic limit of the weight when age(t) approaches infinity; b: the log-function for the proportion of the asymptotic mature weight to be gained after birth; k: the parameter for maturing rate, a function of the ratio of maximum growth rate to mature size; m: the parameter for breakpoint adjustment
** RMS: residual mean square
반면, 미경산 비육암소는 성숙 체중이 더 높게 추정되었는데, Gompertz 모형에서 756.5 ± 9.0 kg, Richards 모형에서 782.3 ± 20.0 kg, von Bertalanffy 모형에서 816.5 ± 12.3 kg로 나타났다(Table 3).
Table 3. Estimation of growth curve parameters for fattening heifers born in 2005-2009.
| Model | Parameters* | RMS** | |||
|---|---|---|---|---|---|
| A ± SE, kg | b ± SE | k ± SE | m ± SE | ||
| Gompertz | 756.5 ± 9.0 | 3.1406 ± 0.0462 | 0.0864 ± 0.0018 | 6.0132 ± 3.5158 | 951.6 |
| Richards | 782.3 ± 20.0 | 0.4300 ± 0.2032 | 0.0761 ± 0.0063 | 950.0 | |
| von Bertalanffy | 816.5 ± 12.3 | 0.7116 ± 0.0080 | 0.0656 ± 0.0017 | 952.2 | |
*A: the parameter for the asymptotic limit of the weight when age(t) approaches infinity; b: the log-function for the proportion of the asymptotic mature weight to be gained after birth; k: the parameter for maturing rate, a function of the ratio of maximum growth rate to mature size; m: the parameter for breakpoint adjustment
**RMS: residual mean square
결과적으로 번식우의 경우 von Bertalanffy 모형이 가장 적합하였으며, 성숙 체중은 미경산 비육암소에 비해 상대적으로 낮게 추정되었다. 이는 번식우와 미경산 비육우 간의 사양 체계와 성장의 차이를 반영하는 결과로 볼 수 있다. 미경산 비육암소는 성장 과정에서 높은 영양 공급과 집중적인 비육 관리로 인해 번식우에 비해 더 큰 성숙 체중을 보였다. 이러한 결과는 육성기부터 번식우와 비육우 간의 사양 체계가 달라 성장 패턴에 영향을 미친다는 것을 시사한다. 특히, 비육우의 경우 고품질 육질을 목표로 한 개량과 사양 전략이 적용되어 높은 체중 증가와 성숙 체중이 달성된 것으로 판단된다. 이는 Park 등(2013)에서 언급한 한우의 근내지방을 목표로 한 육질 개량이 성과를 나타낸 것으로 보인다. 또한, 성장곡선 추정에서 Gompertz 모형과 von Bertalanffy 모형 모두에서 성장곡선의 실측치와 추정치 간 큰 차이를 보이지 않았으며, 이는 모형의 적용에 있어 두 그룹 모두에 적합하다는 것을 의미하였다(Figure 2, Table 4).
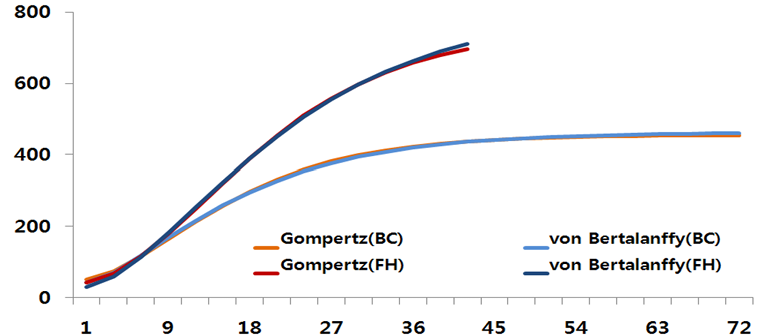
Figure 2. Comparison of growth curves between breeding cows (BC) and fattening heifers (FH).
Table 4. Comparison of measured body weight (OBW, kg) and estimated body weight (EBW, kg) between breeding cows and fattening heifers
| Age (month) |
Breeding cow (Ave ± SE) | Fattening heifer (Ave ± SE) | ||||
|---|---|---|---|---|---|---|
| OBW | EBW Gompertz |
von Bertalanffy | OBW | EBW Gompertz |
von Bertalanffy | |
| 0 | 23.1 ± 0.154 | 40.4 | 31.1 | 23.0 ± 0.703 | 32.7 | 19.6 |
| 3 | 69.9 ± 1.305 | 74.3 | 70.7 | 74.0 ± 3.117 | 67.0 | 58.6 |
| 6 | 129.2 ± 2.014 | 117.4 | 118.5 | 126.4 ± 2.086 | 116.6 | 114.8 |
| 9 | 193.1 ± 2.158 | 165.1 | 168.3 | 191.7 ± 2.453 | 178.7 | 181.4 |
| 12 | 242.1 ± 3.579 | 213.2 | 215.9 | 257.6 ± 3.355 | 248.4 | 252.4 |
| 18 | 288.6 ± 2.070 | 297.8 | 296.4 | 398.2 ± 5.996 | 389.8 | 389.7 |
| 24 | 347.5 ± 4.278 | 359.0 | 354.6 | 518.1 ± 8.340 | 509.7 | 506.1 |
| 30 | 394.6 ± 3.627 | 398.5 | 393.9 | 597.8 ± 9.202 | 597.0 | 596.4 |
| 36 | 446.8 ± 4.001 | 422.5 | 419.5 | 660.3 ± 14.631 | 657.7 | 663.0 |
| 42 | 469.9 ± 4.380 | 436.6 | 435.7 | 721.1 ± 9.368 | 696.0 | 710.6 |
| 48 | 495.2 ± 5.068 | 444.6 | 445.9 | |||
| 60 | 451.8 | 456.2 | ||||
| 72 | 454.1 | 460.1 | ||||
한우 비거세우의 성장곡선은 한우연구센터 집단(A)과 당대검정우 집단(B)으로 나누어 분석되었다. 1980년대 A 집단의 초기 체중은 Gompertz 모형에서 643.8 ± 4.4 kg, von Bertalanffy 모형에서 737.1 ± 6.8 kg로 추정되었고, 1990년대에는 Gompertz 모형에서 759.9 ± 5.5 kg, von Bertalanffy 모형에서 853.9 ± 8.3 kg, B 집단은 Gompertz 모형에서 1038.5 ± 95.2 kg, von Bertalanffy 모형에서 1594.5 ± 259.9 kg로 추정되었다. 2000년대에는 A 집단이 Gompertz 모형에서 801.2 ± 7.3 kg, Richards 모형에서 892.6 ± 19.7 kg, von Bertalanffy 모형에서 905.5 ± 10.7 kg로 추정되었으며, B 집단은 Gompertz 모형에서 563.0 ± 7.4 kg, von Bertalanffy 모형에서 612.5 ± 10.1 kg로 추정되었다(Table 5).
Table 5. Estimation of growth curve parameters for two groups of bulls.
| Times | P** | Model | Parameters* | RMS** | |||
|---|---|---|---|---|---|---|---|
| A ± SE, kg | b ± SE | k ± SE | m ± SE | ||||
| 1980 ~ 1989 | A | Gompertz | 643.8 ± 4.4 | 3.4132 ± 0.0183 | 0.1315 ± 0.0012 | NE | 934.8 |
| Richards | NE | NE | NE | NE | – | ||
| von Bertalanffy | 737.1 ± 6.8 | 0.7367 ± 0.0027 | 0.0917 ± 0.0011 | NE | 957.6 | ||
| 1990 ~ 1999 | A | Gompertz | 759.9 ± 5.5 | 3.6333 ± 0.0296 | 0.1301 ± 0.0014 | NE | 2119.2 |
| Richards | NE | NE | NE | NE | – | ||
| von Bertalanffy | 853.9 ± 8.3 | 0.7707 ± 0.0045 | 0.0925 ± 0.0013 | NE | 2136.8 | ||
| B | Gompertz | 1038.5 ± 95.2 | 3.1683 ± 0.0443 | 0.0793 ± 0.0053 | NE | 1230.0 | |
| Richards | NE | NE | NE | NE | 1230.4 | ||
| von Bertalanffy | 1594.5 ± 259.9 | 0.7163 ± 0.0086 | 0.0438 ± 0.0053 | NE | 1230.4 | ||
| 2000 ~ 2011 | A | Gompertz | 801.2 ± 7.3 | 3.3430 ± 0.0231 | 0.1024 ± 0.0012 | 3.3014 ± 0.4378 | 2495.2 |
| Richards | 892.6 ± 11.9 | 0.7582 ± 0.0567 | 0.0753 ± 0.0032 | NE | 2477.5 | ||
| von Bertalanffy | 905.5 ± 10.7 | 0.7273 ± 0.0053 | 0.0725 ± 0.0010 | NE | 2477.3 | ||
| B | Gompertz | 563.0 ± 7.4 | 3.5077 ± 0.0398 | 0.1642 ± 0.0031 | NE | 1104.3 | |
| Richards | NE | NE | NE | NE | – | ||
| von Bertalanffy | 612.5 ± 10.1 | 0.7948 ± 0.0085 | 0.1264 ± 0.0030 | NE | 1117.7 | ||
*A: the parameter for the asymptotic limit of the weight when age(t) approaches infinity; b: the log-function for the proportion of the asymptotic mature weight to be gained after birth; k: the parameter for maturing rate, a function of the ratio of maximum growth rate to mature size; m: the parameter for breakpoint adjustment
**RMS: residual mean square
***A: Hanwoo Research Center population(0~36 months); B: performance testing population(6~12 months)
잔차제곱평균은 Gompertz 모형과 von Bertalanffy 모형에서 두 집단 간 큰 차이를 보이지 않았으며, 성숙 체중은 von Bertalanffy 모형에서 더 크게 추정되었고, 이는 이전 연구(Kaps 등, 2000; Forni 등, 2009)에서 von Bertalanffy 모형이 소의 성장 특성을 추정하는 데 적합하다고 보고된 결과와 일관된다. 특히, 당대검정우 집단(B)에서는 시기에 따른 성장곡선의 변이가 크게 나타났는데, 이는 해당 집단의 자료가 제한되어 있어 성숙 체중에 대한 정확한 추정이 어려웠기 때문으로 판단된다.
거세 비육우의 성장곡선을 한우연구센터 집단(A), 후대검정우 집단(B), 농가 집단(C)으로 분류하여 추정한 결과, 성장 패턴 및 성숙 체중에서 차이가 나타났다.
1995년부터 2002년까지 A 집단에서는 Gompertz 모형에서 709.0 ± 13.6 kg, von Bertalanffy 모형에서 819.6 ± 21.8 kg로 추정되었고, B 집단과 C 집단에서는 Gompertz 모형과 von Bertalanffy 모형에서 각각 1148.1 ± 31.5 kg, 1562.8 ± 70.8 kg과 1070.1 ± 44.0 kg, 1322.5 ± 82.0 kg로 나타났다. 2003년부터 2011년까지는 A 그룹이 Gompertz 모형에서 893.2 ± 10.4 kg, von Bertalanffy 모형에서 1065.0 ± 17.3 kg로 추정되었으며, B 그룹은 Gompertz 모형에서 1046.2 ± 11.2 kg, von Bertalanffy 모형에서 1285.5 ± 20.8 kg, C 그룹은 Gompertz 모형에서 903.3 ± 13.6 kg, von Bertalanffy 모형에서 1037.2 ± 21.4 kg로 추정되었다(Table 6).
Table 6. Estimation of growth curve parameters for three groups of steers.
| Times | P*** | Model | Parameters* | RMS** | |||
|---|---|---|---|---|---|---|---|
| A ± SE, kg | b ± SE | k ± SE | m ± SE | ||||
| 1995 ~ 2002 | A | Gompertz | 709.0 ± 13.6 | 3.3368 ± 0.0461 | 0.1067 ± 0.0027 | 1.7564 ± 0.2660 | 1411.9 |
| Richards | 990.8 ± 99.4 | 0.9275 ± 0.0452 | 0.0497 ± 0.0091 | 1369.6 | |||
| von Bertalanffy | 819.6 ± 21.8 | 0.7249 ± 0.0045 | 0.0737 ± 0.0024 | 1377.2 | |||
| B | Gompertz | 1148.1 ± 31.5 | 2.8433 ± 0.0133 | 0.0576 ± 0.0015 | NE | 2598.7 | |
| Richards | NE | NE | NE | ||||
| von Bertalanffy | 1562.8 ± 70.8 | 0.6652 ± 0.0026 | 0.0348 ± 0.0014 | 2599.5 | |||
| C | Gompertz | 1070.1 ± 44.0 | 2.6703 ± 0.0269 | 0.0593 ± 0.0027 | NE | 2127.5 | |
| Richards | NE | NE | NE | ||||
| von Bertalanffy | 1322.5 ± 82.0 | 0.6337 ± 0.0042 | 0.0389 ± 0.0025 | 2133.8 | |||
| 2003 ~ 2011 | A | Gompertz | 893.2 ± 10.4 | 3.0874 ± 0.0167 | 0.0821 ± 0.0011 | NE | 1684.8 |
| Richards | NE | NE | NE | ||||
| von Bertalanffy | 1065.0 ± 17.3 | 0.6910 ± 0.0023 | 0.0553 ± 0.0010 | 1633.1 | |||
| B | Gompertz | 1046.2 ± 11.2 | 2.9353 ± 0.0083 | 0.0740 ± 0.0009 | NE | 1692.5 | |
| Richards | NE | NE | NE | ||||
| von Bertalanffy | 1285.5 ± 20.8 | 0.6745 ± 0.0012 | 0.0490 ± 0.0008 | 1695.3 | |||
| C | Gompertz | 903.3 ± 13.6 | 2.8911 ± 0.0226 | 0.0806 ± 0.0016 | NE | 1061.6 | |
| Richards | NE | NE | NE | ||||
| von Bertalanffy | 1037.2 ± 21.4 | 0.6665 ± 0.0036 | 0.0570 ± 0.0015 | 1046.1 | |||
*A: the parameter for the asymptotic limit of the weight when age(t) approaches infinity; b: the log-function for the proportion of the asymptotic mature weight to be gained after birth; k: the parameter for maturing rate, a function of the ratio of maximum growth rate to mature size; m: the parameter for breakpoint adjustment
**RMS: residual mean square
***A: Hanwoo Research Center population(0~30 months); B: progeny testing population(6~24 months); C; commercial farm population(6~30 months)
비거세우와 거세우 결과 모두에서 Richards 모형은 대부분의 모수가 추정되지 않았으며, 이는 해당 모형이 수소의 성장 패턴을 설명하는 데 제한적일 수 있음을 시사한다. Richards 모형은 비대칭적인 성장곡선을 유연하게 설명할 수는 있지만, 전 구간에 걸쳐 자료가 고르게 분포되지 않으면 수렵이 어렵고, 파라미터 추정이 불안정해 질 수 있다 (Loibel 등, 2011). 이에 따라 본 연구에서 대부분의 모수가 추정되지 않은 이유는 자료의 수 보다는 관측 시점이 특정 성장 단계에 편중되어 있어서 전체적인 성장 곡선을 고르게 반영하지 못했기 때문으로 판단된다.
거세우의 성장곡선 분석 결과, Gompertz 모형과 von Bertalanffy 모형 모두 거세우의 성장 패턴을 안정적으로 추정하였으며, 이는 거세로 인한 호르몬 변화와 사양 방법의 차이가 성장에 미치는 영향을 잘 반영하였다. 거세우는 비거세우에 비해 성숙 체중이 더 높게 나타났으며 (Table 7), 이는 비육 기간 동안 지방 축적과 근육 성장에 집중하는 사양 전략이 적용된 결과로 볼 수 있다. 특히, von Bertalanffy 모형은 Gompertz 모형보다 더 높은 성숙 체중을 추정하였고, 이는 거세우 사양의 표준화 및 육종 전략 수립에 유용한 정보를 제공할 수 있다.
Table 7. Comparison of Estimated body weight by age between bulls and steers*.
| Age (month) | Bull | Steer | ||||||||
|---|---|---|---|---|---|---|---|---|---|---|
| Gompertz | von Bertalanffy | Gompertz | von Bertalanffy | |||||||
| A* | B* | A | B | A | C** | A | C | |||
| 3 | 68.5 | 66.0 | 64.3 | 58.1 | 80.0 | 99.7 | 75.9 | 93.7 | ||
| 6 | 131.3 | 152.0 | 133.8 | 151.5 | 135.4 | 159.2 | 136.3 | 158.1 | ||
| 9 | 211.9 | 252.9 | 216.6 | 253.5 | 204.4 | 231.6 | 207.5 | 233.1 | ||
| 12 | 301.2 | 345.3 | 303.9 | 344.7 | 282.1 | 312.7 | 284.4 | 314.4 | ||
| 15 | 390.2 | 417.6 | 389.0 | 418.3 | 362.8 | 397.7 | 362.7 | 398.1 | ||
| 18 | 472.0 | 469.1 | 468.0 | 474.3 | 411.6 | 482.1 | 439.3 | 481.4 | ||
| 21 | 542.9 | 530.3 | 515.0 | 562.5 | 512.1 | 562.0 | ||||
| 24 | 601.7 | 600.8 | 580.8 | 636.5 | 579.7 | 638.4 | ||||
| 27 | 649.1 | 653.9 | 638.0 | 702.7 | 641.4 | 709.7 | ||||
| 30 | 686.3 | 698.8 | 686.7 | 760.6 | 697.0 | 775.4 | ||||
| 33 | 714.9 | 736.5 | 727.2 | 746.5 | ||||||
| 36 | 736.8 | 767.7 | 760.6 | 790.3 | ||||||
*Estimated body weight was based on the growth curve parameters of bulls which were born from 2000 to 2011 or one of steers which were born from 2003 to 2011.
**A: Hanwoo Research Center population; B: performance testing population; C: progeny testing population
본 연구는 한우의 성장곡선을 성별과 사양 방법에 따라 세분화하여 분석함으로써, 한우의 성장 특성에 대한 이해를 높이고 표준화된 성장곡선 모수를 제시하였다. 특히 von Bertalanffy 모형이 모든 집단에서 가장 낮은 RMS 값을 보여, 한우 성장곡선 추정에 가장 적합한 모델로 확인되었다. 이는 본 모형이 한우의 생리학적 성장 메커니즘을 잘 반영하며, 실제 사양 및 개량 현장에서 활용하기에 안정성과 해석력이 뛰어남을 시사하였다. 앞으로의 연구에서는 다양한 환경 및 사양 조건을 반영하고, 보다 많은 최근 개체 자료를 활용하여 성장 곡선 모수를 다시 추정해보고 유전적 요인과 환경적 요인이 성장곡선에 미치는 영향을 종합적으로 평가할 필요가 있다. 이를 통해 한우 개체의 성장 패턴에 대한 정밀한 이해가 가능해지며, 생산성과 품질 향상을 위한 맞춤형 사양 관리 및 육종 전략 수립이 가능해질 것이다. 이러한 연구는 한우 성장 및 사양에 관한 표준화된 데이터베이스를 구축하는 기반이 되며, 이를 활용한 유전적 개량과 정밀 사양 기술 개발은 한우 산업의 지속 가능한 발전과 국내 축산업의 경쟁력 강화에 핵심적인 역할을 할 것으로 기대된다.
No potential conflict of interest relevant to this article is reported.
농촌진흥청(Rural Development Administration) 기관고유연구사업(과제번호: PJ01502803)의 지원에 의해 이루어진 것이며, 연구비 지원에 감사드립니다.
Arango JA and Van Vleck LD. 2002. Size of beef cows: Early ideas, new developments. Genet Mol Res 1:51-53.
[DOI]
Beltran JJ, Butts WT Jr, Olson TA and Koger M. 1992. Growth patterns of two lines of Angus cattle selected using predicted growth parameters. J Anim Sci 70:734-741.
[DOI]
Brown JE, Fitzhugh HA and Cartwright TC. 1976. A comparison of nonlinear models for describing weight-age relationship in cattle. J Anim Sci 42:810-818.
[DOI]
Bullock KD, Bertrand JK and Benyshek LL. 1993. Genetic and environmental parameters for mature weight and other growth measures in Polled Hereford cattle. J Anim Sci 71:1737-1741.
[DOI]
Cho KH, Na SH, Choi JG, Seo KS, Kim SD, Park BH, Lee YC, Park JD and Son SG. 2006. Estimation of growth curve parameters and analysis of year effect for body weight in Hanwoo. J Anim Sci Technol 48(2):151-160.
[DOI]
Choi TJ, Seo KS, Kim SD, Cho KH, Choi JG, Hwang IH, Choi HS and Park CJ. 2008. Estimation of growth curve parameters for body weight and body size traits in Hanwoo steers. J Anim Sci Technol 50(5):601-612.
DeNise RSK and Brinks JS. 1985. Genetic and environmental aspects of the growth curve parameters in beef cows. J Anim Sci 61:1431-1440.
[DOI]
Forni S, Piles M, Blasco A, Varona L, Oliveira HN, Lôbo RB and Albuquerque LG. 2009. Comparison of different nonlinear functions to describe Nelore cattle growth. J Anim Sci 87:496-506.
[DOI]
Kaps M, Herring WO and Lamberson WR. 2000. Genetic and environmental parameters for traits derived from the Brody growth curve and their relationships with weaning weight in Angus cattle. J Anim Sci 78:1436-1442.
[DOI]
Loibel S, Andrade MG, do Val JBR and de Freitas AR. 2011. Richards growth model and viability indicators for populations subject to interventions. An Acad Bras Cienc 83(4):1403-1414.
[DOI]
Lopez de Torre G, Candotti JJ, Reverterl A, Bellido MM, Vasco P, Garcia LJ and Brinks JS. 1992. Effects of growth curve parameters on cow efficiency. J Anim Sci 70:2668-2672.
[DOI]
Nelder JA. 1961. The fitting of a generalization of the logistic curve. Biometrics 19:89.
[DOI]
Oliveira HN, Lobo RB and Pereira CS. 2000. Comparacao de modelos nao-lineares para descrever o crescimento de femeas da raca Guzera. Pesqui Agropecu Bras 35:1843-1851.
[DOI]
Park B, Choi T, Kim S and Oh SH. 2013. National genetic evaluation (system) of Hanwoo (Korean native cattle). Asian-Australas J Anim Sci 26:151-156.
[DOI]
Richards FJ. 1959. A flexible growth function for empirical use. J Exp Bot 10:290.
[DOI]
Santoro RS, Barbosa SBP, Brasil LHA and Santos ES. 2005. Estimativas de parametros de curvas de crescimento de bovinos zebu, criados no estado de Pernambuco. Rev Bras Zootec 34:2262-2279.
[DOI]
Lee CW, Choi JG, Chun KJ, Na KJ, Lee CY, Hwang JM, Kim BW and Kim JB. 2003. Estimation of parameters for individual growth curves of cows in Bos taurus coreanae. J Anim Sci Technol 45(5):689-694.
[DOI]
Von Bertalanffy L. 1957. Quantitative laws in metabolism and growth. Q Rev Biol 32:217.
[DOI]
West GB, Brown JH and Enquist BJ. 2001. A general model for ontogenetic growth. Nature 413(6856):628-631.
[DOI]
Winsor CR. 1932. The Gompertz curve as a growth curve. Proc Natl Acad Sci 18:1.
[DOI]
국립축산과학원. 2011. 한우 월령에 따른 체중발육 표준 활용. 영농활용자료.
김내수, 주종철, 송만강, 정정수, 최양일, 박철진. 2002. 한우 거세 및 비거세우의 성장곡선 특성. 동물자원지 44:519-522.
[DOI]
조용민. 2000. 한우의 성장곡선모수 추정 및 경제형질과의 상관관계 추정에 관한 연구. 서울대학교 박사학위논문.